Threat Hunting Basics: Getting Manual

Table of contents:
The purpose of this blog is to explain the necessity for manual (non-alert based) analysis methods in threat hunting. An example of effective manual analysis via aggregations/stack counting is provided.
Automation Is Necessary
Automation is absolutely critical and as threat hunters we must automate where possible as much as possible.
However, automation is built on assumptions about data or how the automation will be effective in a given environment. Many times these assumptions have been made for the threat hunter by other analysts, engineers, system owners, etc. As an example, a common assumption is the whitelisting of process creation events from System Center Configuration Monitor (SCCM) or other endpoint management products in alert based detections. Another example is SIEM engineers filtering out unused logs to save resources. Attackers are increasingly aware of identifying such assumptions and remaining hidden within them. For instance, tools have been written to identify weaknesses in a system’s sysmon configuration [1].
By peeling back and inspecting the layers of assumptions threat hunters may have success in identifying gaps in visibility and hunt on these gaps to uncover a compromise. This blog post focuses on removing some of these assumptions by using aggregations to efficiently review interesting data manually.
Manual Approaches are Necessary
Perhaps the dominant threat hunting premise is “Assume Compromise”. Responding to a compromise (almost) always involves manual human analysis and intervention especially during scoping. Effective scoping doesn’t just involve reviewing alerts. Effective scoping involves manual analysis of known compromised hosts for indicators and behaviors that can be searched against in the rest of the environment. Therefore, as threat hunters if we are “Assuming Compromise”, manual analysis is inherently required.
Another way of looking at this is to observe that by only reviewing alert based data, we are assuming that a successful attacker will trigger at least one rule/alert within our environment that is clear and actionable enough for us to make a decision that results in identifying the compromise.
That being said, threat hunters should not burden themselves with manual analysis of each log for every data source in the environment. Instead we must identify a way to get our brains reviewing relevant data and making decisions as effectively as possible.
Peeling back the logic we are using to alert on events and aggregating on the fields and contexts we use in our alerting is an example of effective manual analysis for most environments.
Aggregation as an Example (Stack Counting)
One of the simplest and most effective methods for manual hunting approaches is aggregating on interesting/actionable fields of passive data collection given a specific context.
If you’ve ever used Microsoft Office’s pivot tables, Splunk’s stats command, or Arcsight’s “top” command you are familiar with this concept.
Note: This technique is also commonly referred to as stack counting, data stacking, stacking, or pivot tables :). I believe novice hunters will be more familiar with the concept of aggregating so I use that term here. Fireeye appears to be the first to publish this concept in the context of threat hunting [2].
Note: Passive data is a data source that tells you about an event whether it is security relevant or not. For instance, a passive data source might tell you that a process was created, a network connection was established, a file was read/written to, etc. Host logs, such as Windows Event Logs are great examples of a passive data source. Passive data sources are major part of the backbone for most threat hunting programs.
As an example, Image 1 shows part of an aggregation of all sysmon network connection events with destination port 22 (SSH) in an environment over 30 days. A threat hunter might use this aggregation to ‘hunt’ processes that would normally not be associated with connections over port 22.
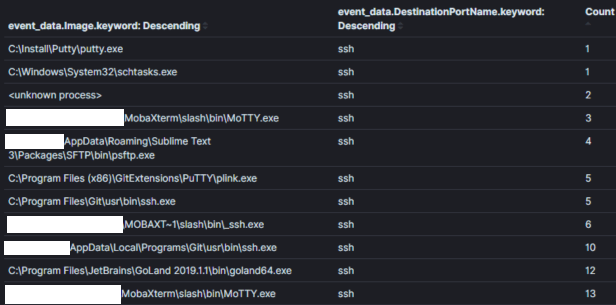 Image 1: Simple Aggregation in Kibana
Image One:
Aggregation Field: Process Name
Context: Processes using port 22 within 30 days
Results: 120
Time to Analyze: < 1 min
Context is king in hunting with aggregations and it contains the intent of your hunt hypothesis. The context of an aggregation is typically set in the underlying query and exposed to the analyst via the fields we aggregate on and observe. In Image 1 the context of “Processes using port 22” is converted to the query logic (symon_eid == 3 AND destination port == 22) and by aggregating/displaying the field containing process names.
It is important to strike a balance between how narrow or broad the context is within an aggregation. As an example, in Image 2 I broadened the context from the previous Image to return all processes with network connections. It’s possible to find evil this context, however, it will be harder to make decisions about the data unless there is an obvious unusual process name or a process that would never really have network activity (which is increasingly uncommon).
Image 2:
Aggregation Field: Process Name
Context: Processes with network connections
Results: 1000+
Time to Analyze: 1 min
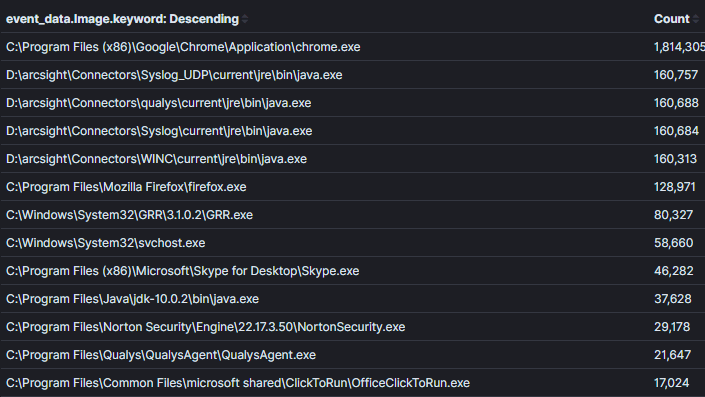 Image 2: A less effective aggregation without enough context
Finally, aggregations become less effective when fields which will not be used to make decisions are aggregated against. In Image 3, I added the “process id” field to our last aggregation. Knowing the process ID may be useful once we identify an unusual process, however it creates a duplicate entry for each unique process name and id combination. In the running example the results more than quadrupled and many process names were duplicated. It is important to aggregate on fields that enable you to make decisions. Information that may be required to identify a specific host or user for triage should be identified using an additional query with narrow context. In the example from image 1 if we wanted to identify who was using putty for SSH, we can use the logic (process_name==”*putty.exe” AND sysmon_eid==3). In my opinion, this is a place where Kibana outshines other analytics tools I’ve used because pivoting between queries and dashboards is highly efficient via their pinnable filtering system [4].
Image 3:
Aggregation Field: Process Name + Process ID
Context: Processes with network connections
Results: 1000+
Time to Analyze: 10 mins
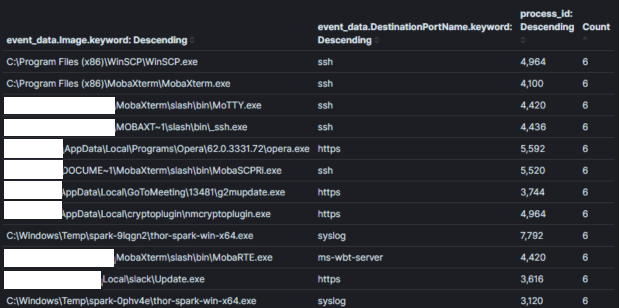 Image 3: A less effective aggregation with non-context fields
Note: In certain systems like elasticsearch’s Kibana it is easy to pivot from one data table to another using their dashboards. Otherwise, once you identify an interesting aggregation an analyst will typically switch to reviewing the host(s) or account(s) that were observed performing the interesting behavior.
Note: You should be aware of the trap of outlier detection. Don’t rely on the concept of “common is good and “uncommon is bad” in aggregations/stack counting. This is not necessarily true, as compromises generally involve multiple machines and adversaries may try to take advantage of this assumption to create noise and appear normal. Additionally, niche software and use cases exist in almost every environment. It is easy to get caught up triaging every “least common” stack and wasting time identifying false positives. Knowing the environment pre-compromise and honing your instincts about threat actor behavior [3] will help you here.
But does it scale?
Manual analysis of logs doesn’t scale nearly as well as alerting as an analyst typically will observe a single context at a time. For instance reviewing a single aggregation with tens or even hundreds of thousands of results is common. The longest time you want to find yourself reviewing an aggregation is probably 10 mins. If as a threat hunter you find yourself getting overwhelmed, you might try narrowing the context. For instance, you can split a 20,000 host environment into two 10,000 host environments with query logic that separates hosts by their names. Alternatively you might identify critical assets/accounts containing the “golden nuggets” or “keys to the kingdom” and performing manual analysis on those.
It is possible to create content, review alerts, and triage hosts efficiently enough to have time for more manual threat hunting techniques.
The SIEM content available in SOC Prime’s TDM [5] is rich with content that can be completely automated as alerts as well as content to enable more manual approaches to threat hunting.
Resources and Shoutouts on previous work:
[1] https://github.com/mkorman90/sysmon-config-bypass-finder
[2] https://www.fireeye.com/blog/threat-research/2012/11/indepth-data-stacking.html
[3] https://socprime.com/blog/warming-up-using-attck-for-self-advancement/
[4] https://www.elastic.co/guide/en/kibana/current/field-filter.html
[5] https://tdm.socprime.com/login/