

In the previous article, we have examined simple integration with external web resources using drilldowns. If you missed it, follow the link: https://socprime.com/en/blog/simple-virus-total-integration-with-splunk-dashboards/
Today we will get acquainted with one more interesting variant of drilldowns in Splunk: using depends panels.
Depends panels in Splunk: an interesting way to use drilldowns in dashboards
Very often there is a need to get more detailed information about an event in dashboard table and we need to make drilldown to another event for further investigation.
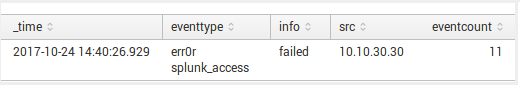
For example, we have a table with events that show possible brute force attack on our service.
Search for that events is:
![]()
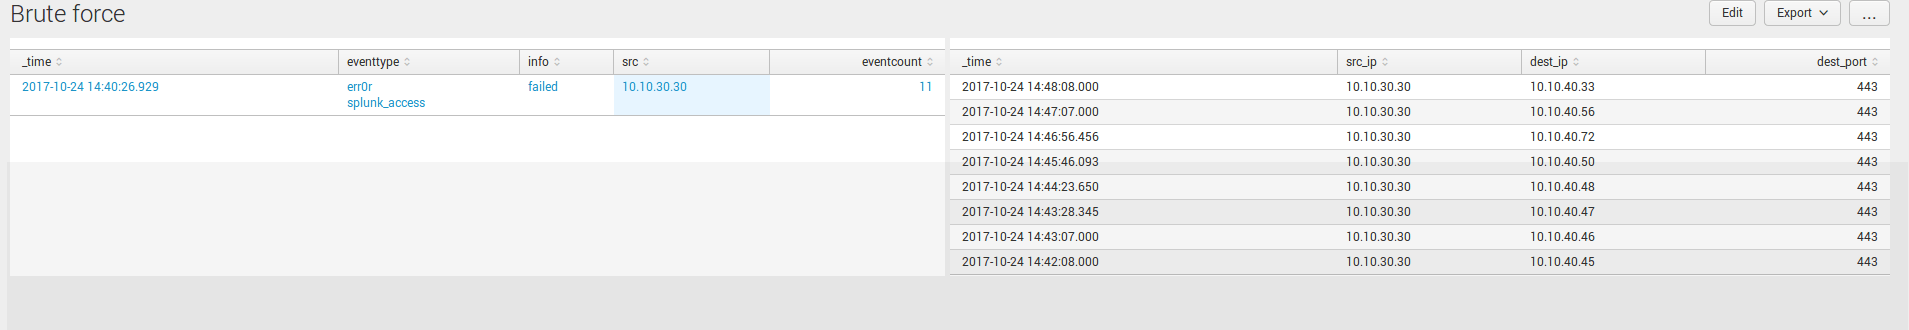
In the table on dashboard, we see that someone tried to authenticate from one host to Splunk server and authentication was failed 11 times. It looks like someone from host 10.10.30.30 tried to brute force user credentials to our Splunk server.
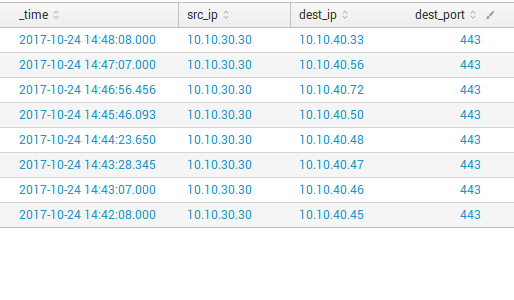
Ok, let’s view network statistic for further investigation for that host. In this case, it will be convenient to use drilldown from this table to another table by src token – depends panel, the table that will appear to the right if you click on search. On the right side, we will see all connections from that host (this is an example of depends panel).
Thus, we need to make second table panel with information about connections and save it on our dashboard:
index=* tag=network src_ip=10.10.30.30 | table _time src_ip dest_ip dest_port
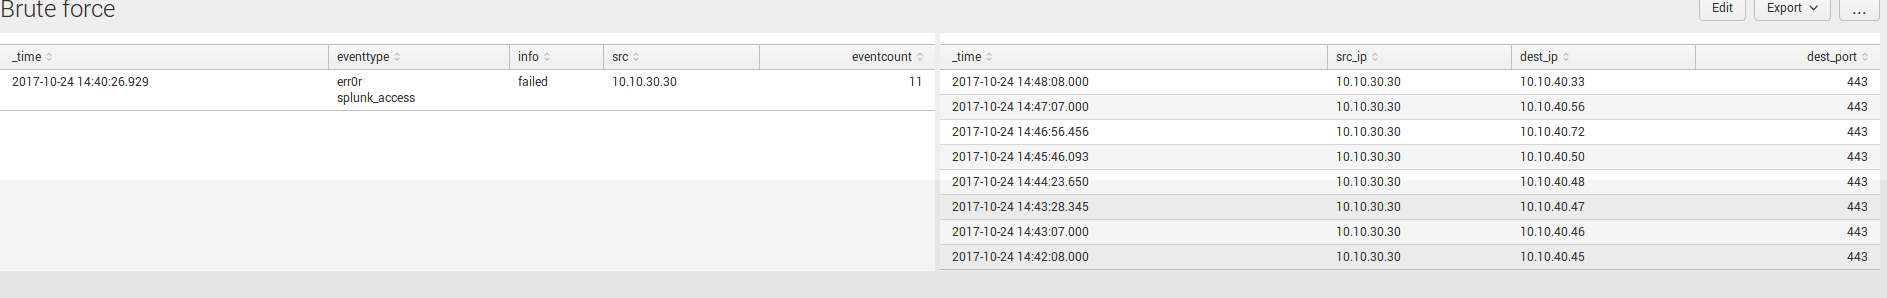
Now we have two independent panels with independent searches on our dashboards:
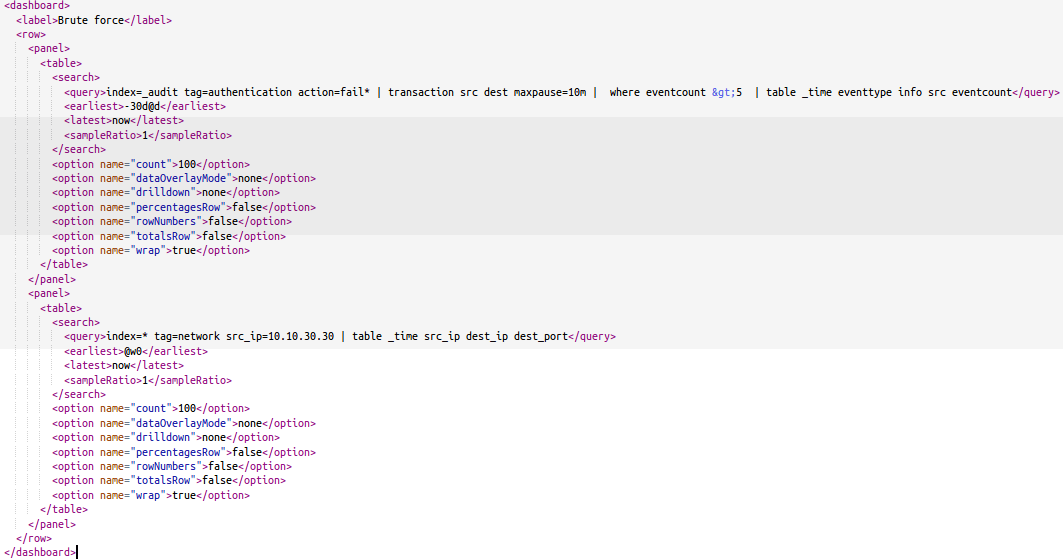
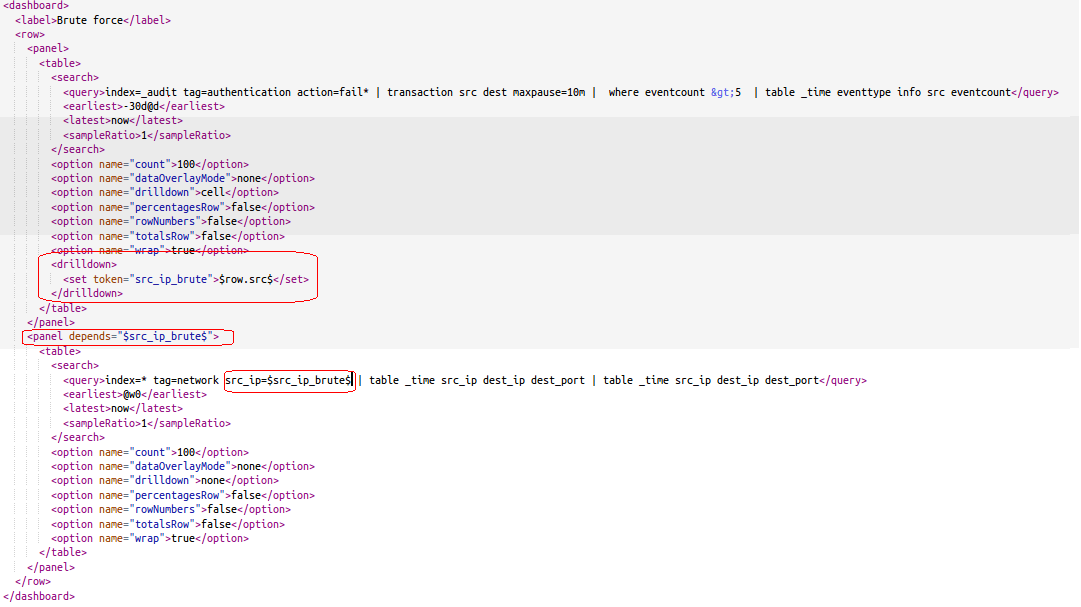
Source code of dashboard is:
Let’s make it so that the second table appears by clicking on src field on the first table, with the substitution of the value from the first table to the second table.
Declare a drilldown from the first panel with a token “src_ip_brute”:
<drilldown>
<set token=”src_ip_brute”>$row.src$</set>
</drilldown>
We will use the value of the token in the second table:
index=* tag=network src_ip=$src_ip_brute$ | table _time src_ip dest_ip dest_port
So, now we need to add ‘depends’ option to the panel tag. Source of dashboard will be:
As a result, we have a second panel with the substitution of the value from the first panel, which is displayed only if you click on the search on the first panel:

In this article, we have studied one more interesting feature of the panels and the construction of dashboards, which allows you to focus on the details of the event and obtain additional information from other events. I described a particular case of creating drilldown, and you can use this method to make all your dashboards and graphs more informative to facilitate and speed up the investigation of every incident.