

There are a lot of interesting cases that you can find while investigating anomalies in the traffic baselines, for example, in FTP, SSH, or HTTPS. This guide describes how to use the “Imperva WAF – Kibana Dashboard, Watchers and Machine Learning for ELK Stack” Content Pack to detect abnormal spikes of attacks identified by WAF from a single IP to a single web application.
Downloading Content Pack for Detecting Network Spikes for the Elastic Stack
-
- Log in to the SOC Prime Platform with your work-associated account.
- Go to Threat Detection Marketplace > Get Started.
- Select Search from the navigation panel.
- In the Content Search field, type “imperva waf”.
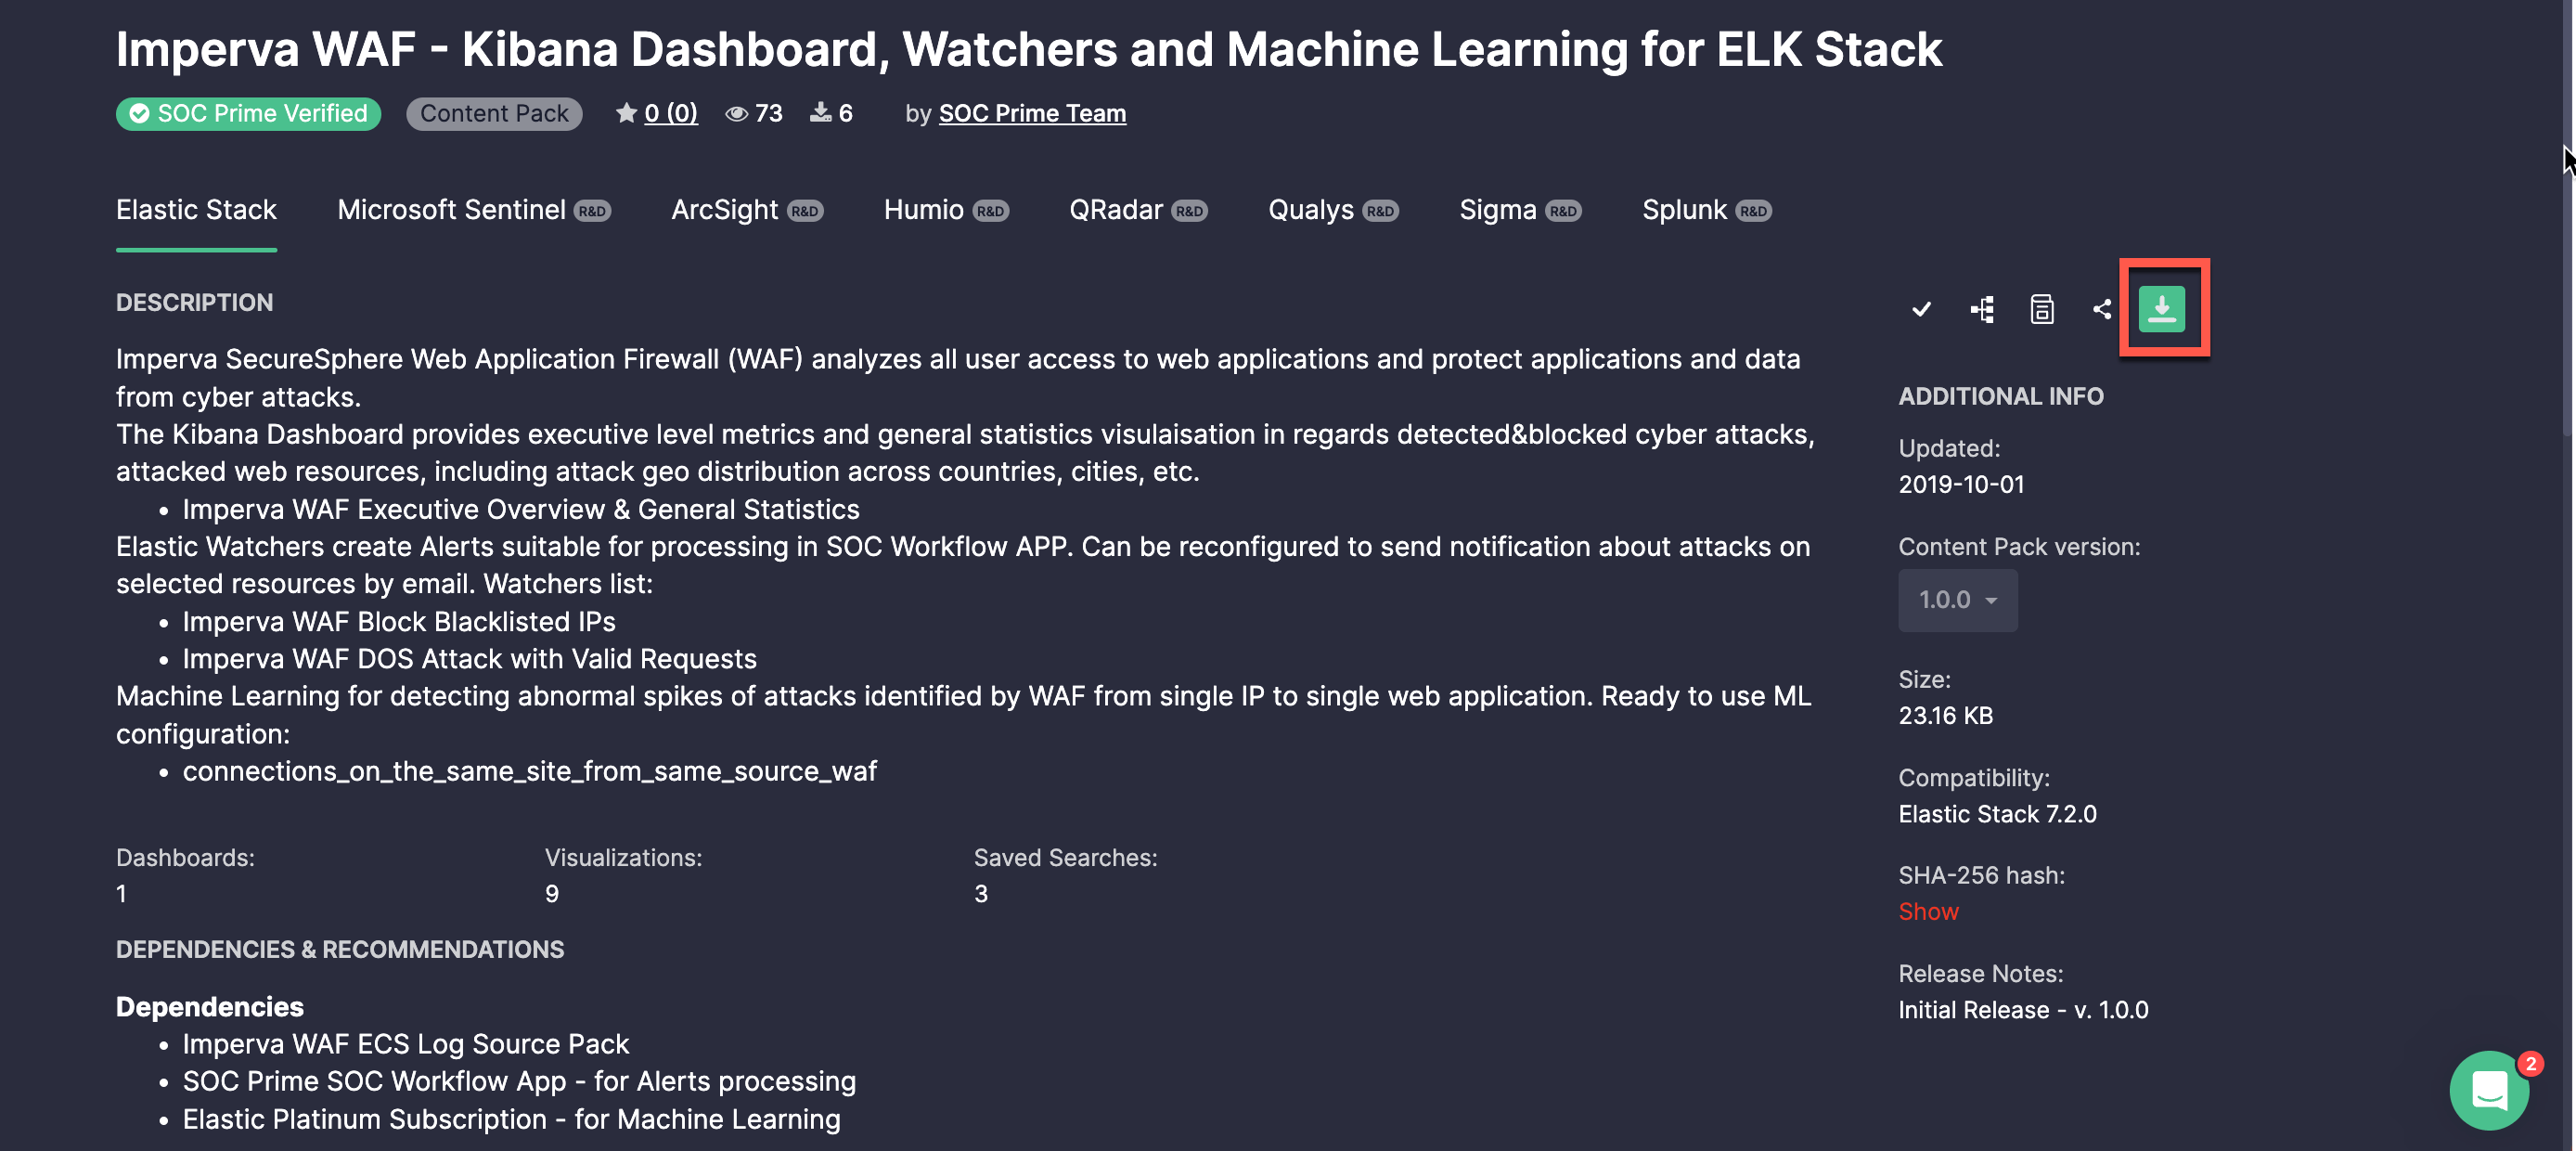
- Click the “Imperva WAF – Kibana Dashboard, Watchers and Machine Learning for ELK Stack Content Pack” to open the content item page.
- Check the Dependencies and Log Source Requirements sections to see if your system meets the requirements for the content deployment.
- Click the Download button.
Note: Detection content availability depends on your current SOC Prime subscription tier. Learn more at https://my.socprime.com/pricing/
Deploying Content into Your Kibana Instance
Log in to your Kibana and import content using the following steps:
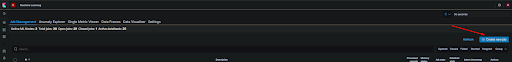
- Create a new ML (Machine Learning) job by clicking the Create new job button in the upper right-hand corner of the page.
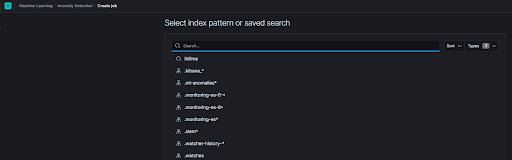
- Select the required index pattern or a saved search Imperva WAF logs.
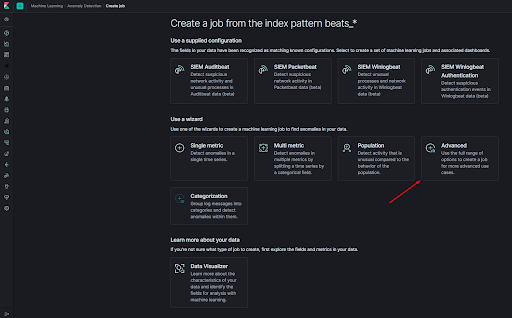
- Select the Advanced tile from the list of wizards to create an advanced job.
- In the Edit JSON tab, paste the JSON configuration of the downloaded ML Job.
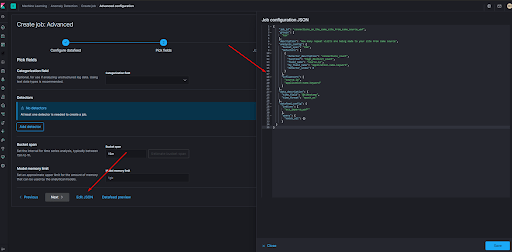
- Click the Next button to pass validation.
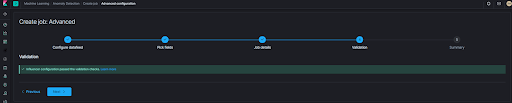
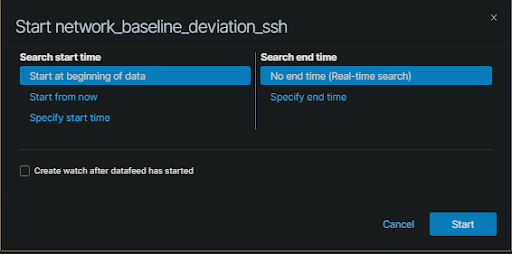
Note: In case you have a different field template, please make the corresponding changes in the JSON code. - After successful validation, save the changes to complete the job creation by clicking the Start button. Here, you can specify the time frame or set the job to Real-time search.
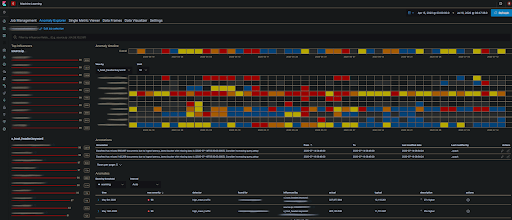
- As a result, you will get the visualization of network spikes or abnormal SSH traffic activity that needs investigation.
Have any questions? Reach out to us via the SOC Prime Platform chat or get in touch with us on Discord.