

SOC Prime Threat Detection Marketplace (SOC Prime TDM) has been created as a SaaS content platform that helps companies advance their security analytics. Therefore, supercharging analytical capabilities and providing real-time statistics is one of the core features we at SOC Prime consider of paramount value. Data visualization helps deliver data in a more intuitive way and allows getting a clear picture of the company’s progress in terms of proactive threat detection.
The SOC Prime TDM platform has already represented the Leaderboards page covering the general SOC Prime TDM statistics on top authors, content release dynamics, MITRE ATT&CK® coverage, leading platforms by rule count, and other data in numbers. With the latest SOC Prime Threat Detection Marketplace release, the platform gets another analytics-based page that gains insights into the company statistics and explores the company-wide activity using the SOC Prime TDM community for proactive threat detection.
The Dashboard page displays the company statistics over the selected time range, compares the data with other companies in the similar industry, and indicates the trend as compared to the previous period.
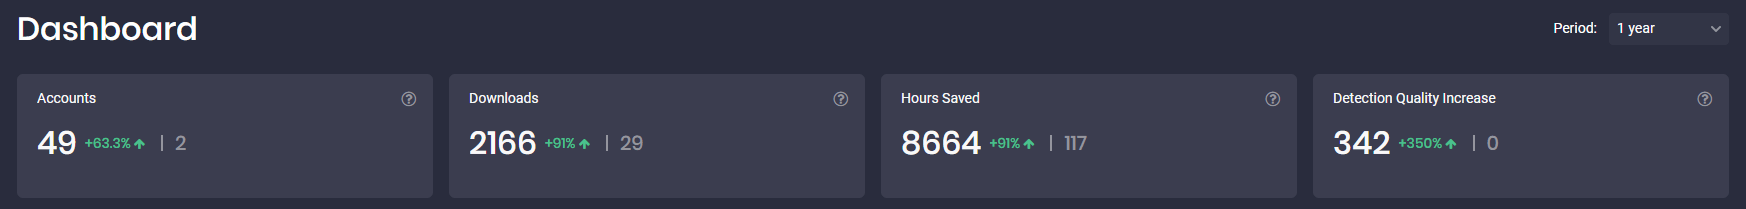
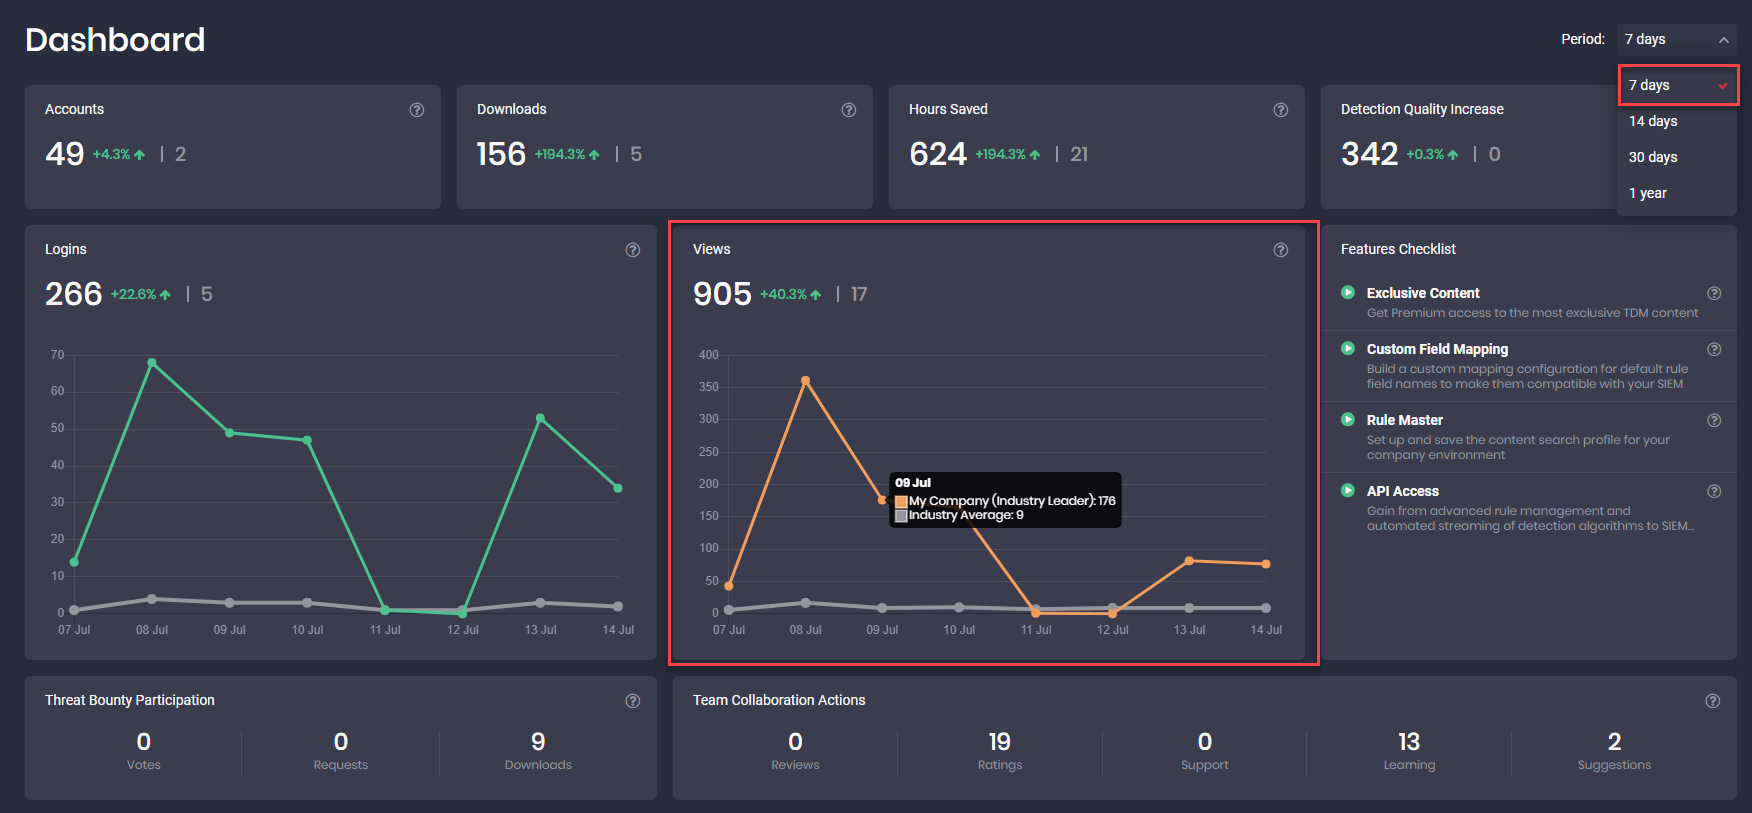
By default, all company statistics are displayed for the annual period, but can also be filtered by a less lengthy time frame — from a monthly period to a range of 7 days.
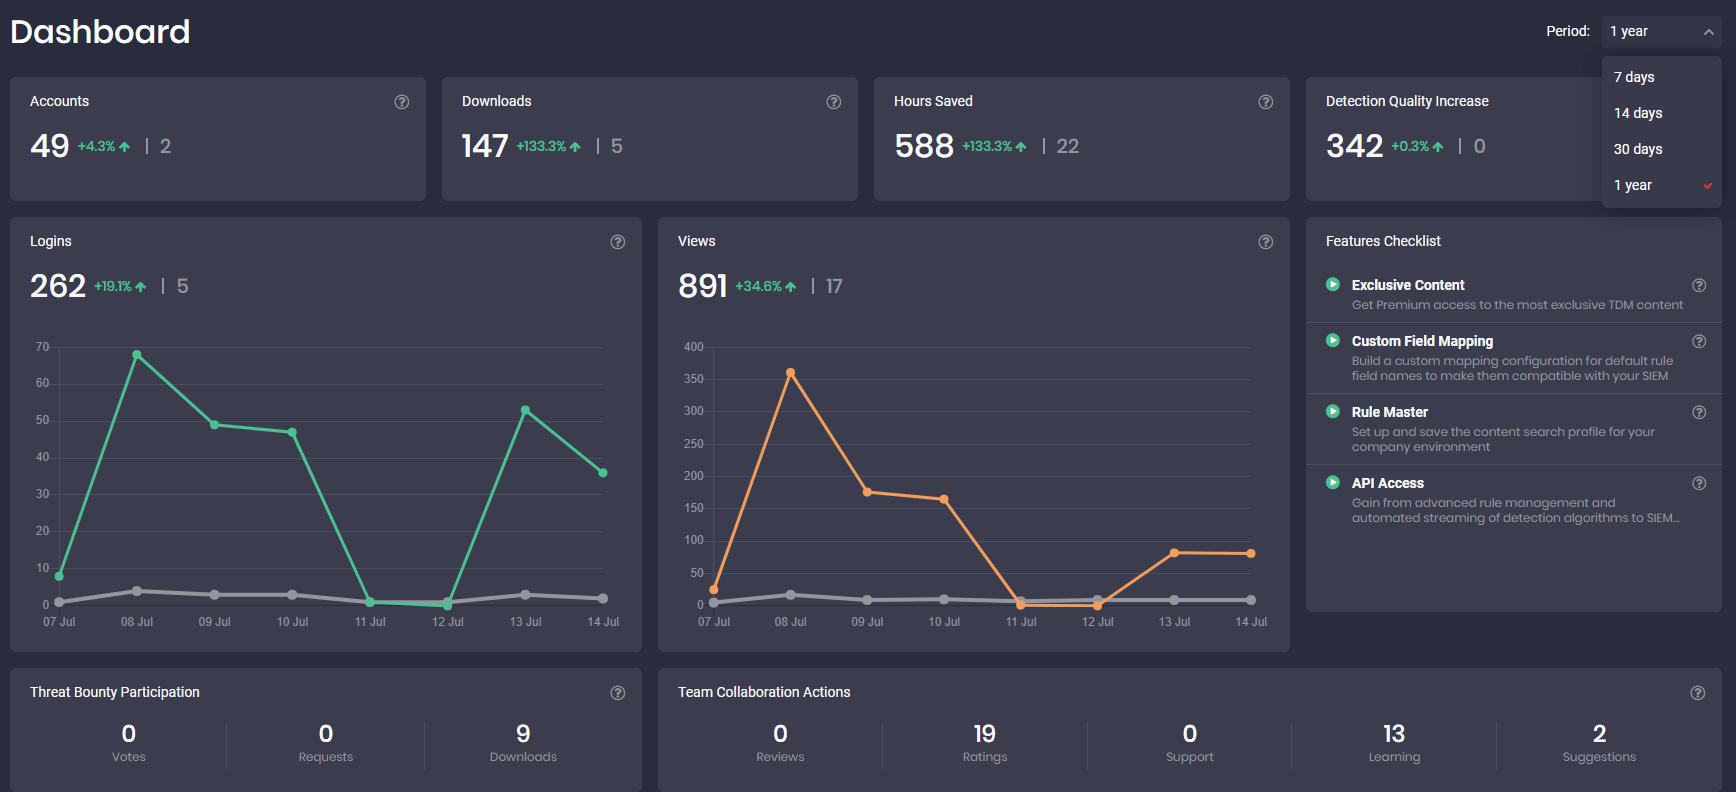
Accounts
Top security performers use SOC Prime TDM daily and weekly depending on their role, such as CISOs, SOC Managers, Security Analysts, Threat Hunters, Detection Engineers, members of Threat Intelligence and Incident Response teams. The Accounts dashlet on the Dashboard page displays how many SOC Prime TDM user accounts the company has created over the selected time frame with the trend direction and comparison with your industry average. The growing trend of active SOC Prime TDM accounts highlights that the company is channeling more efforts into proactive threat detection.
Downloads
The most relevant threat detection content reflecting the latest attack vectors is constantly enriching the SOC Prime Threat Detection Marketplace platform. The Downloads dashlet on the Dashboard page displays how many content items have been downloaded by all company users over the selected time period with the trend direction and comparison with your industry average. The upward trend directly reflects that security practitioners tend to keep up with the latest threats and attack methods, consistency, and continuation of the process.
Hours Saved
A lot of research is needed to cover all recent attacks that are becoming more and more elaborate with the advance of new technologies used by threat actors, and companies are struggling with a lack of resources to satisfy these needs. The Hours Saved dashlet displays how much time your company has managed to save on research and development of the threat detection content over the selected time period with the trend direction and comparison with your industry average. Reducing research and development time by acquiring content from SOC Prime TDM helps to channel your company resources into security monitoring and incident response activities.
Detection Quality Increase
This dashlet on the Dashboard page reflects the progress and quality of your threat detection and hunting capabilities benchmarked against the MITRE ATT&CK® framework. Improving the threat coverage is a continuous process and the trend direction should be increasing over time until the consistent coverage across all relevant TTPs is reached with further focus on updates and adjustments based on business needs.
Logins
Top security performers have security specialists check SOC Prime TDM daily and leverage the platform capabilities on a weekly or a bi-weekly basis. This line chart displays the number of company logins to TDM over the selected time period with the trend direction and comparison with your industry average. The line chart compares your company’s TDM login trend over the selected frame with the industry average trend. Points on the line chart indicate particular time periods depending on the selected time range — from months for a one-year period to days for a period of one week. By hovering over each time point on the line chart, you can see a tooltip with the color-coded chart legend displaying your company’s trend (green) vs. industry average trend (gray).
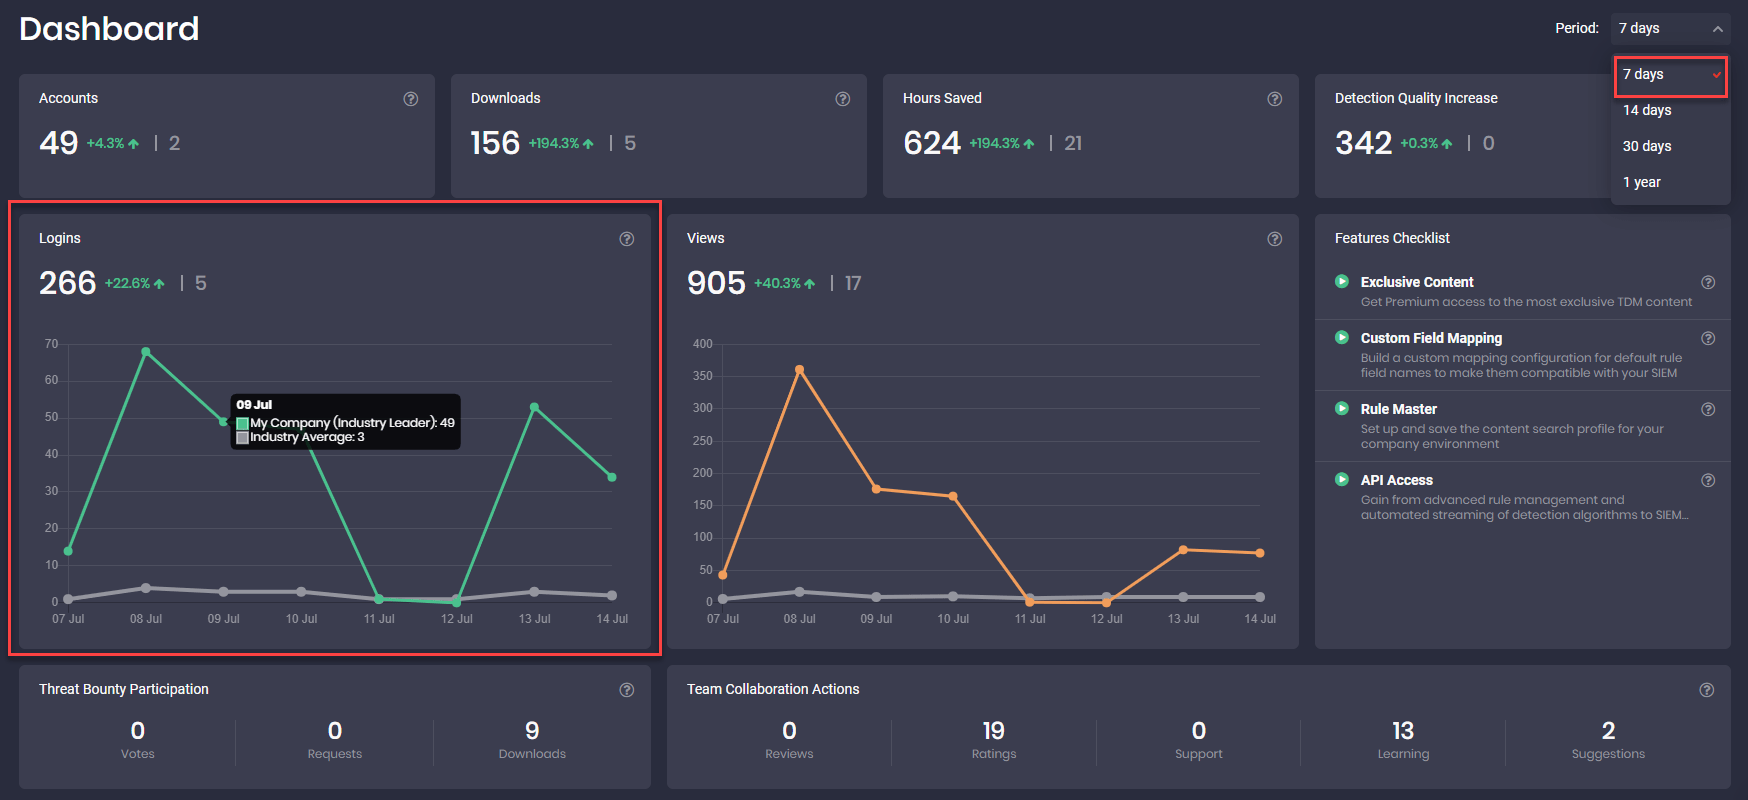
Views
The ever-changing threat landscape requires significant efforts from security practitioners to let them continuously keep up with the dynamic attack vectors. This line chart displays the number of content your SOC team has viewed over the selected time frame with the trend direction and comparison with your industry average. The growing viewing activity reflects your company’s learning potential to explore new threats and defense strategies. The line chart compares your company’s TDM content views trend over the selected period with the industry average trend. Points on the line chart indicate particular time periods depending on the selected time range — from months for a one-year period to days for a weekly period. By hovering over each time point on the line chart, you can see a tooltip with the color-coded chart legend displaying your company’s trend (orange) vs. industry average trend (gray).
Threat Bounty Participation
This dashlet on the Dashboard page displays the company’s contribution to the development and usage of new threat detection content created by Threat Bounty Program developers. This includes the number of votes for the most expected content on the SOC Prime TDM Wanted page, the number of submitted content requests made by your team, and the number of downloaded content items crafted by Threat Bounty developers. The more active is this contribution, the more opportunities the SOC Prime TDM platform has in stock to deliver content that is neatly matching your company’s most pressing security needs.
Team Collaboration Actions
This dashlet displays how cohesive is the collaboration between your company’s team and SOC Prime. It displays the following statistics on the company’s collaboration activities:
● The number of Reviews and Ratings on downloaded content that are critical for the content quality improvement
● The number of Support requests and content Suggestions that both directly contribute to better onboarding and continuous content quality improvement
● The Learning counter that shows the company’s team activity in exploring onboarding reading guides and watching tutorial videos for in-depth understanding of the SOC Prime TDM features and capabilities

Features Checklist
This section on the Dashboard page displays the list of activated Premium SOC Prime TDM features and their statuses as part of the Free Trial access to SOC Prime TDM. The Free Trial access lets users with the Community subscription get a brilliant opportunity to test out the Premium SOC Prime TDM features during the 14-day trial period:
● Exclusive TDM content that includes rules, queries, and playbooks addressing the latest Exploits, CVE, Malware, Hacktools, and TTPs used by APT groups. Exclusive content is crafted by Threat Bounty developers, SOC Prime Team members, and other content authors and is tagged with MITRE ATT&CK to focus on the most company-specific threats.
● Custom Field Mapping allows SOC Prime TDM users to create a customized data schema profile of their SIEM instance and automatically deploy threat hunting content compatible with their SIEM environment.
● Rule Master allows setting up a company profile matching the particular environment characteristics, the company’s infrastructure and tailored to your actual log sources to get the most relevant search results.
● API Access offers advanced rule management with the ability to download all Sigma rules on the fly directly into your SIEM such as Microsoft Azure Sentinel, Sumo Logic, Elastic Stack, Splunk, and other back-end environments.
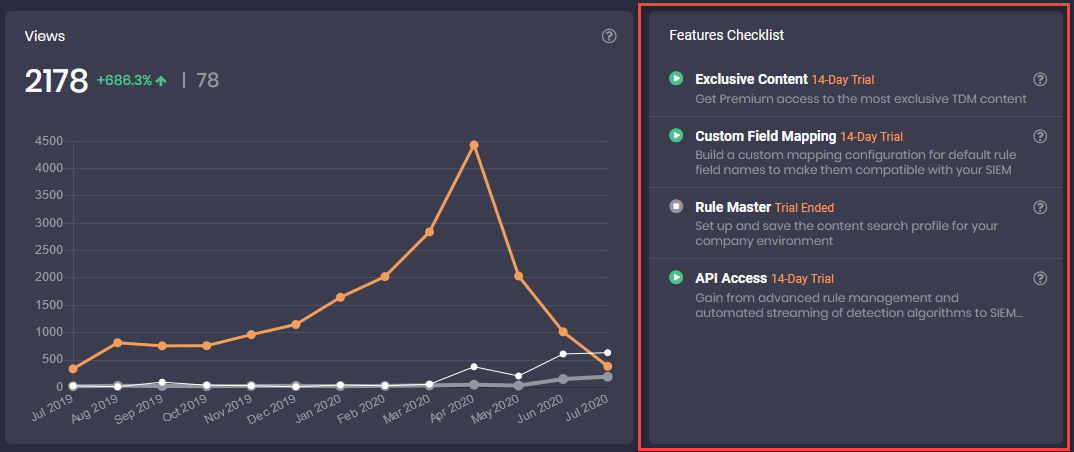
Free Trial Statuses
The trials statuses next to the corresponding Free Trial feature indicate the following:
● 14-Day Trial
The trial feature hasn’t been activated yet, and the status displays the period during which it can be in use
● Trial Ended
The trial period for this feature has run out
● X Trial Days Left
The number of days (X) remaining to use this trial feature
● Last Trial Day
The last day when the trial feature can be in use
The Dashboard page is a unique opportunity for companies with the TDM subscription to measure their progress on proactive threat detection, analyze the trends, and build improvements roadmap for strengthening their capabilities to explore new threats and defense strategies and increase the content quality.