

In the previous article, we have examined using depends panel for creating convenient visualizations in dashboards. If you missed it, follow the link: https://socprime.com/blog/using-depends-panels-in-splunk-for-creating-convenient-drilldowns/
Many people who begin to study Splunk have questions about monitoring the availability of incoming data: when the last time the data came from a particular source, when the data ceased to arrive or what sources are not available now.
Thus, today we will make a simple dashboard with information about the availability of sources in our Splunk.
How to keep up to date with the accessibility of sources
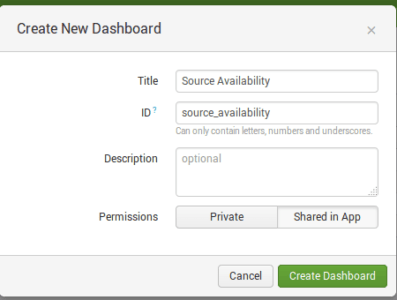
1. At first, let’s create a dashboard with title ‘Source Availability’:
2. Then we make a search request for statistic table building.
It is necessary to make search request for the statistical table in all indexes data (index=*): we would like to search the last event from every host and source, for doing that we’ll use ‘stats’ command:
index=* | stats max(_time) as last_time by host, source
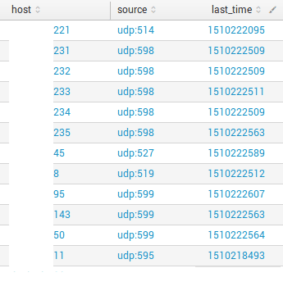
‘last_time’ field shows us the last time in the Unix time format when events came into Splunk.
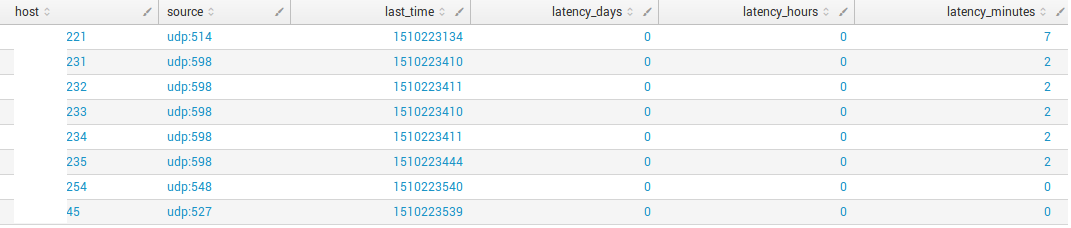
3. Now we add and calculate variables ‘Minutes ago’, ‘Hours ago’, ‘Days ago’.
For minutes:
eval latency_minutes=round((now()-last_time)/60,0)
For Hours:
eval latency_hours=round(latency_minutes/60,0)
For Days:
eval latency_days=round(latency_hours/24,0)
Note: ’round’ is used for rounding and getting an integer.
Result:
4. Ok, now let’s rename fields and convert ‘last_time’ to the human-readable format. Also, it is required to add a trigger condition field: if latency_minutes more than 5 status if ‘Off’, if less than 5 minutes –‘On’:
![]()
5. As a result, we see the next dashboard:
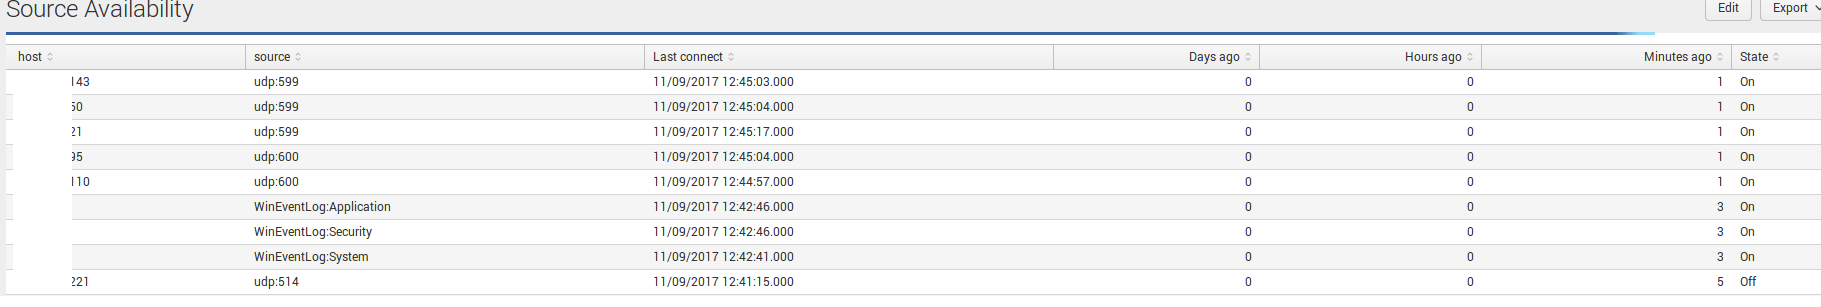
In this article, I demonstrated how to make a simple search request for monitoring accessibility of sources. Using this method, you can quickly determine what source is missing or has become unavailable. This logic can also be used with other types of data, where it is necessary to monitor that the process did not crash and is still online. Instead of sources, you can use any other events and fields for monitoring. So, the next week, I am going to demonstrate how to change the color of a cell depending on the value to build informative tables.