
Many SIEM users ask a question: How do Splunk and HPE ArcSight SIEM tools differ?
ArcSight users are confident that correlation events in ArcSight are a weighty argument in favor in using this SIEM because Splunk does not have the same events. Let’s destroy this myth.
Splunk has many options to correlate events. So in this article, we will consider a correlation method similar to ArcSight Correlation Events.
At first, I will briefly describe the principle of work; then we will study a specific example based on events.
Events that lead to the triggering of a rule are called correlated events. In turn, the resulting event with general information on the trigger is called a correlation event. Thus, correlated events are used to create correlation events. Subsequently, correlation events can also be correlated with other events to build more complex logic.
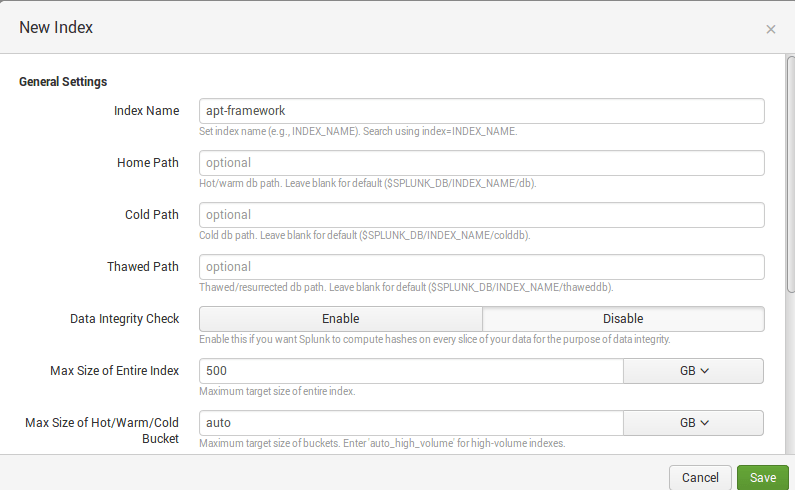
Well, let`s try to generate correlation events in Splunk. Create a separate index for correlation events, for example ‘apt-framework’:
Create a search query that will periodically look for hosts that perform ports scanning on the network:
index=* ( tag::eventtype=”communicate” OR tag::eventtype=”network”) | bucket _time span=60 | eventstats dc(dest_port) AS PortsScanned by src_ip, _time | where PortsScanned> 50 | dedup src_ip, PortsScanned | eval rule=”Internal Port Scan” | eval stage=”Stage 7 – Reconnaissance” | table src_ip, PortsScanned, _time, stage, rule, source, sourcetype
Table of results:
![]()
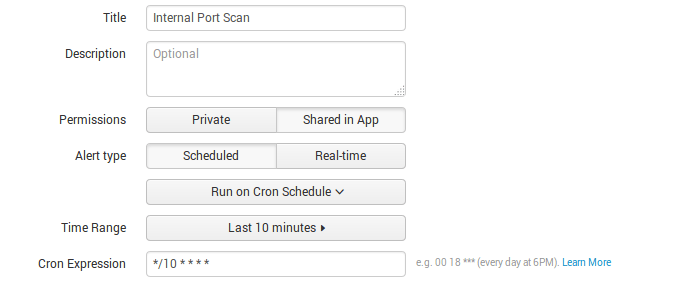
Then create Alert with Saved Search that will search every 10 minutes in the last 10 minutes for hosts that perform port scanning:
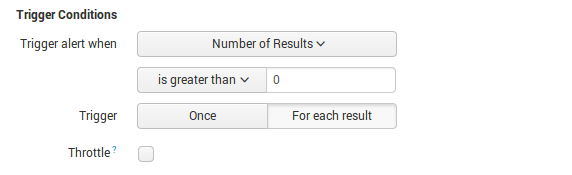
Ok, now you need to specify the parameters for correlation events creation. To do this, add action and chose Log Event:
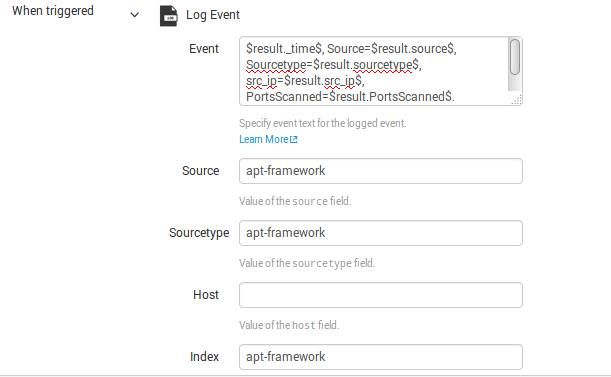
You need to specify all fields, which you want to see in a correlation event from search result.
In our case:
$result._time$, Source=$result.source$, Sourcetype=$result.sourcetype$, src_ip=$result.src_ip$, PortsScanned=$result.PortsScanned$, stage=”$result.stage$”, rule=”$result.rule$”
As a result, every 10 minutes for the last 10 minutes, Saved Search detects hosts that perform port scanning, and Splunk generates and saves correlation events to the ‘apt-framework’ index:
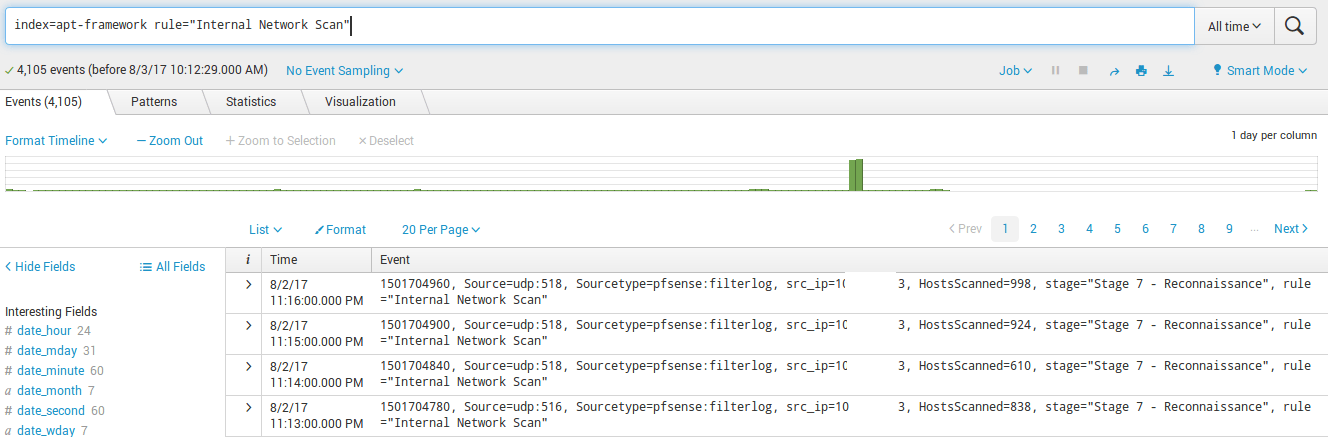
You can easily use these events in further requests. Usage of a separate index and correlation events will considerably reduce a load on the Splunk search engine. Happy Splunking!