Follow
 Every day, your SOC drowns in isolated alerts — a suspicious login here, an odd process spawn there, a strange outbound connection somewhere else. Individually, each one looks like noise. Together, they might be the early signature of a coordinated adversary campaign already unfolding inside your environment. The problem isn’t a lack of data — it’s a lack of connection.
Attack Chains changes that equation. Instead of asking your analysts to manually stitch together dozens of low-confidence signals, Attack Chains does it for them automatically — correlating historical scan results across your SIEM, EDR/XDR, and Data Lake (Prime Hunt), or real-time event streams as they’re generated, before that data even reaches your SIEM (Prime Detect). Either way, it doesn’t correlate against a static, generic rule set — it correlates against Active Threats: newly identified, real-world threats as they’re published to detect potential Attack Chains before they become confirmed incidents. That means your detection logic is only ever as current as the threat landscape itself.

Where to find it: Attack Chains lives as its own tab inside both Prime Hunt and Prime Detect. If you’re working with historical data, go to Prime Hunt → Attack Chains. If you want real-time correlation before data hits your SIEM, go to Prime Detect → Attack Chains.
Always Watching for What’s New
Once you’re in Attack Chains, the Monitored Threats tab shows every Active Threat your environment is being correlated against. Attack Chains stays current without any effort on your part. The moment a new threat is identified in the wild, it’s already part of what your environment is being checked against — no waiting for a rule update, no manual research cycle. You still decide what matters most to your organization, focusing correlation on the threats most relevant to your industry or risk profile.
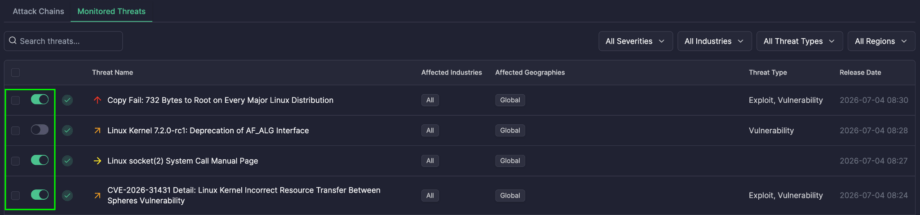
Enable or disable individual threats, or apply bulk actions to manage several at once — right from the Monitored Threats list — so your correlation scope always reflects what actually matters to your organization.
And if a threat’s detection coverage isn’t actually working — whether it hasn’t been scanned yet or a rule isn’t properly connected — you’ll see it right away, instead of finding out after the fact. Here’s what that looks like:
A green checkmark means a threat’s detection coverage is fully in place. An issue label flags a gap — click it to see exactly what’s missing.
The Picture Attack Chains Give You
Once a chain forms, it’s not just a correlated pile of events — it’s an investigation-ready story, at both a program-wide and case-by-case level.
At a glance, your Attack Chains Overview gives you a real-time pulse on your overall exposure: how many chains have been built, how many active threats are currently being watched, how many hosts are involved, and how much of your detection coverage is actually firing. It’s the kind of summary that turns “are we being targeted?” into a number you can check in seconds.

Click into any individual chain from the Attack Chains tab, and your team gets:
- An AI-generated summary of the detected activity, so analysts get immediate context
- A visual timeline of adversary techniques, showing exactly how the attack progressed step by step — with techniques already confirmed by detection rules, plus activity caught through fuzzy pattern matching (Prime Hunt)
- Threat actor and technique attribution, mapped to industry-standard frameworks, so scoping and context-building start immediately instead of from scratch
- A clear match, showing how closely the activity lines up with a known attack pattern — so your team knows exactly how seriously to treat it
- Full asset and environment context — which host, which part of your infrastructure, and which of your data sources picked it up — so there’s no guessing where to look next
- A direct path back into your existing tools, letting analysts pivot straight into the underlying events without losing time or context
- A built-in investigation trail, tracking the status of the Attack Chain from first detected to fully resolved, and nothing falls through the cracks
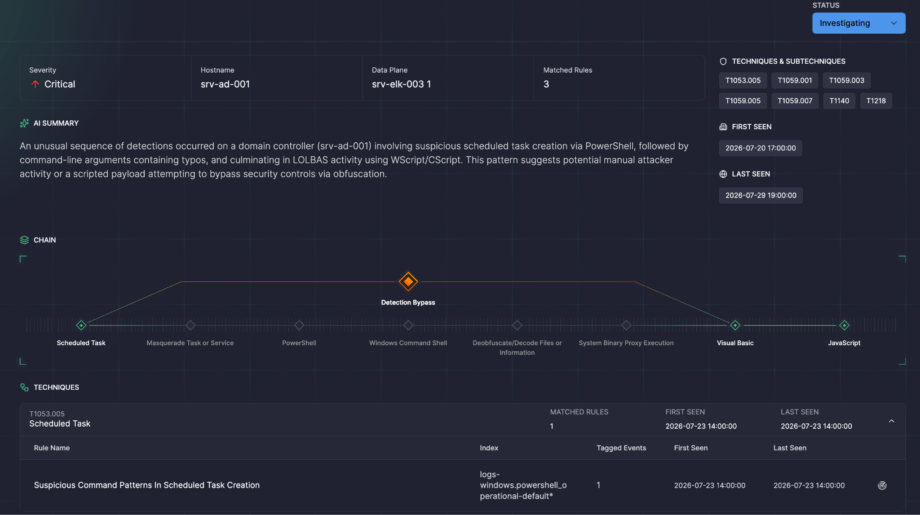
Low-confidence noise is filtered out by the AI, so what reaches your team by default is what actually deserves their attention — with the option to dig into everything else whenever they choose to.
Bringing It All Together: Configuring Attack Chain Correlation
With the threat intelligence and the picture it produces in mind, here’s how you tell Attack Chains exactly how to correlate it:

- Set the chain-forming threshold — the minimum percentage of a threat’s technique sequence that must match before Attack Chains are formed
- Define the correlation window — how close together in time events must occur to be correlated
- Define the lookback window — how far back the engine searches when hunting for related events (Prime Hunt only)
- Choose your data sources — include or exclude the SIEM, EDR/XDR, and Data Lake sources (Prime Hunt) or topics (Prime Detect) feeding correlation, and optionally auto-enroll new ones as they’re added
- Review data-sharing settings — hostname data needs to be transmitted and stored for correlation to work, which may require explicit consent (Prime Hunt)
- Save and click Run — Attack Chain monitoring is live from that point on, continuously checking your environment against the newest threats as they emerge