Follow
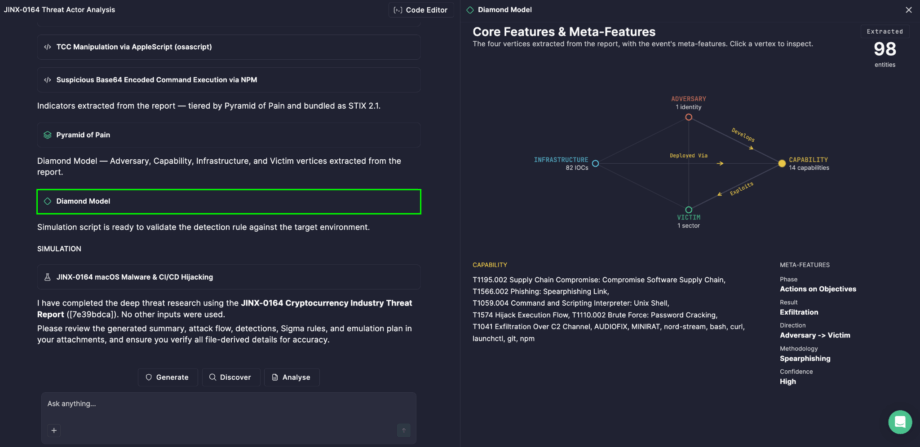
 Every intrusion involves more than just malware or a compromised IP — it involves a threat actor, the tools they wield, the infrastructure they operate through, and the victim they target. Understanding how these elements connect is often more valuable than looking at any one of them in isolation. That’s why Prime Architect visualizes adversary activity using the Diamond Model — generated automatically as part of Deep Threat Research analysis, helping your team see not just what happened, but how the pieces of an intrusion relate to one another.
Mapping the Four Corners of an Intrusion
The Diamond Model of Intrusion Analysis is a threat intelligence framework built on a simple premise: every malicious event can be broken down into four core elements, and mapping the relationships between them reveals far more about an adversary’s operation than examining indicators in isolation. Rather than a flat list of IOCs, the model gives analysts a structural view of the intrusion itself.
The Diamond Model displays four vertices, each representing a core element of the analyzed threat:
- Adversary — the threat actor or organization behind the activity
- Capability — the tools, malware, and techniques the adversary used
- Victim — the targeted entities or organizations
- Infrastructure — the systems, resources, and services used to carry out the activity
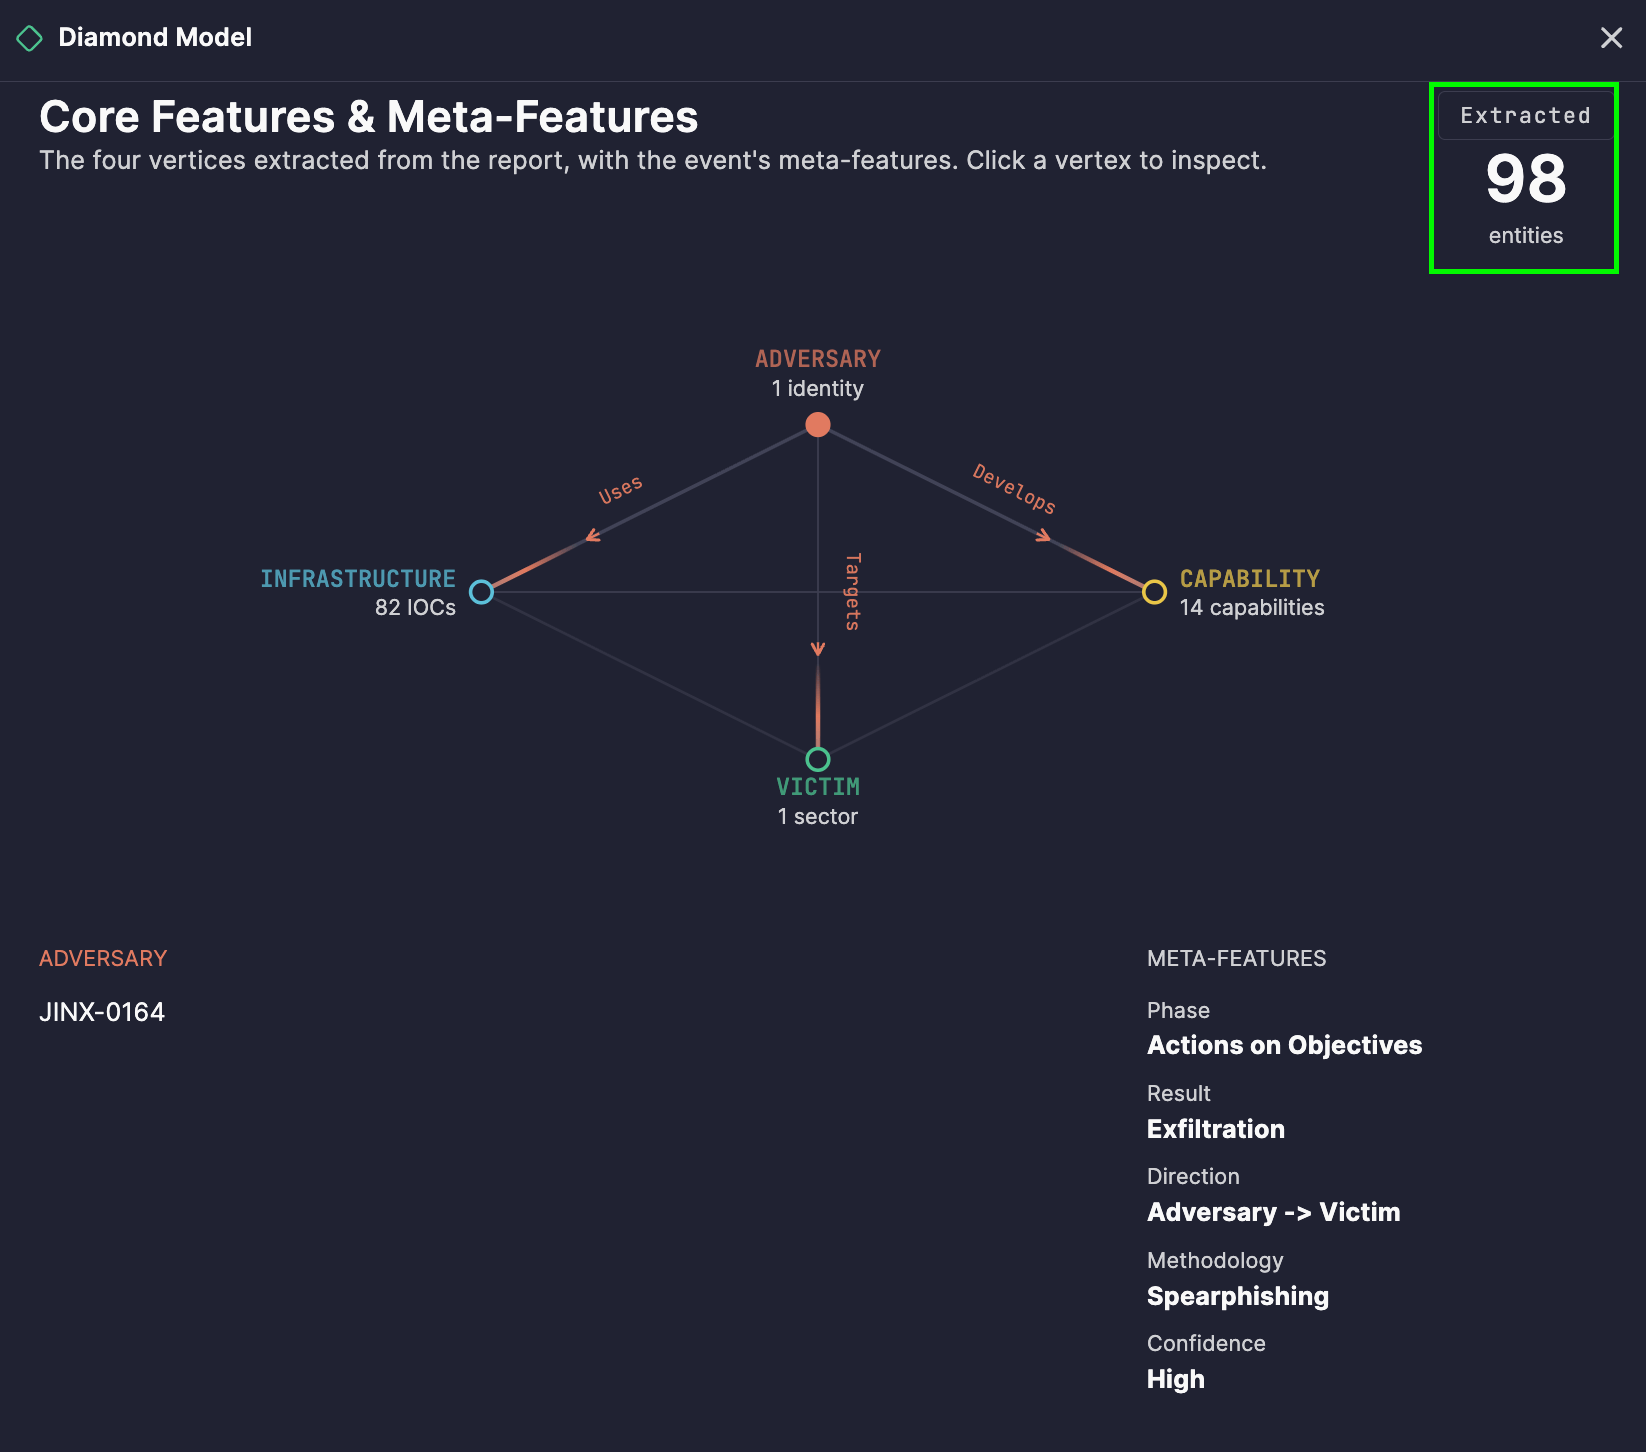
In Prime Architect, the Diamond Model visualizes these four vertices based on the entities actually extracted from the analyzed threat report, and each vertex displays the number of extracted entities associated with it — giving you an immediate sense of how much detail was found for each element of the intrusion.
Reading the Connections
A diamond isn’t just four points — it’s the relationships between them that tell the real story. The diagram represents connections between vertices using directional relationships, including Connects To, Uses, Exploits, Targets, Develops, and Deployed via. These directional links show, for example, which capability an adversary used to exploit a specific victim, or which infrastructure was used to deploy a given tool.
Hovering over a vertex highlights it and reveals its related connections, making it easy to trace how a threat actor’s tools, targets, and infrastructure tie together — without having to manually cross-reference a written report.
An Extracted counter in the diagram shows the total number of entities identified during the analysis, giving you a quick sense of scale.
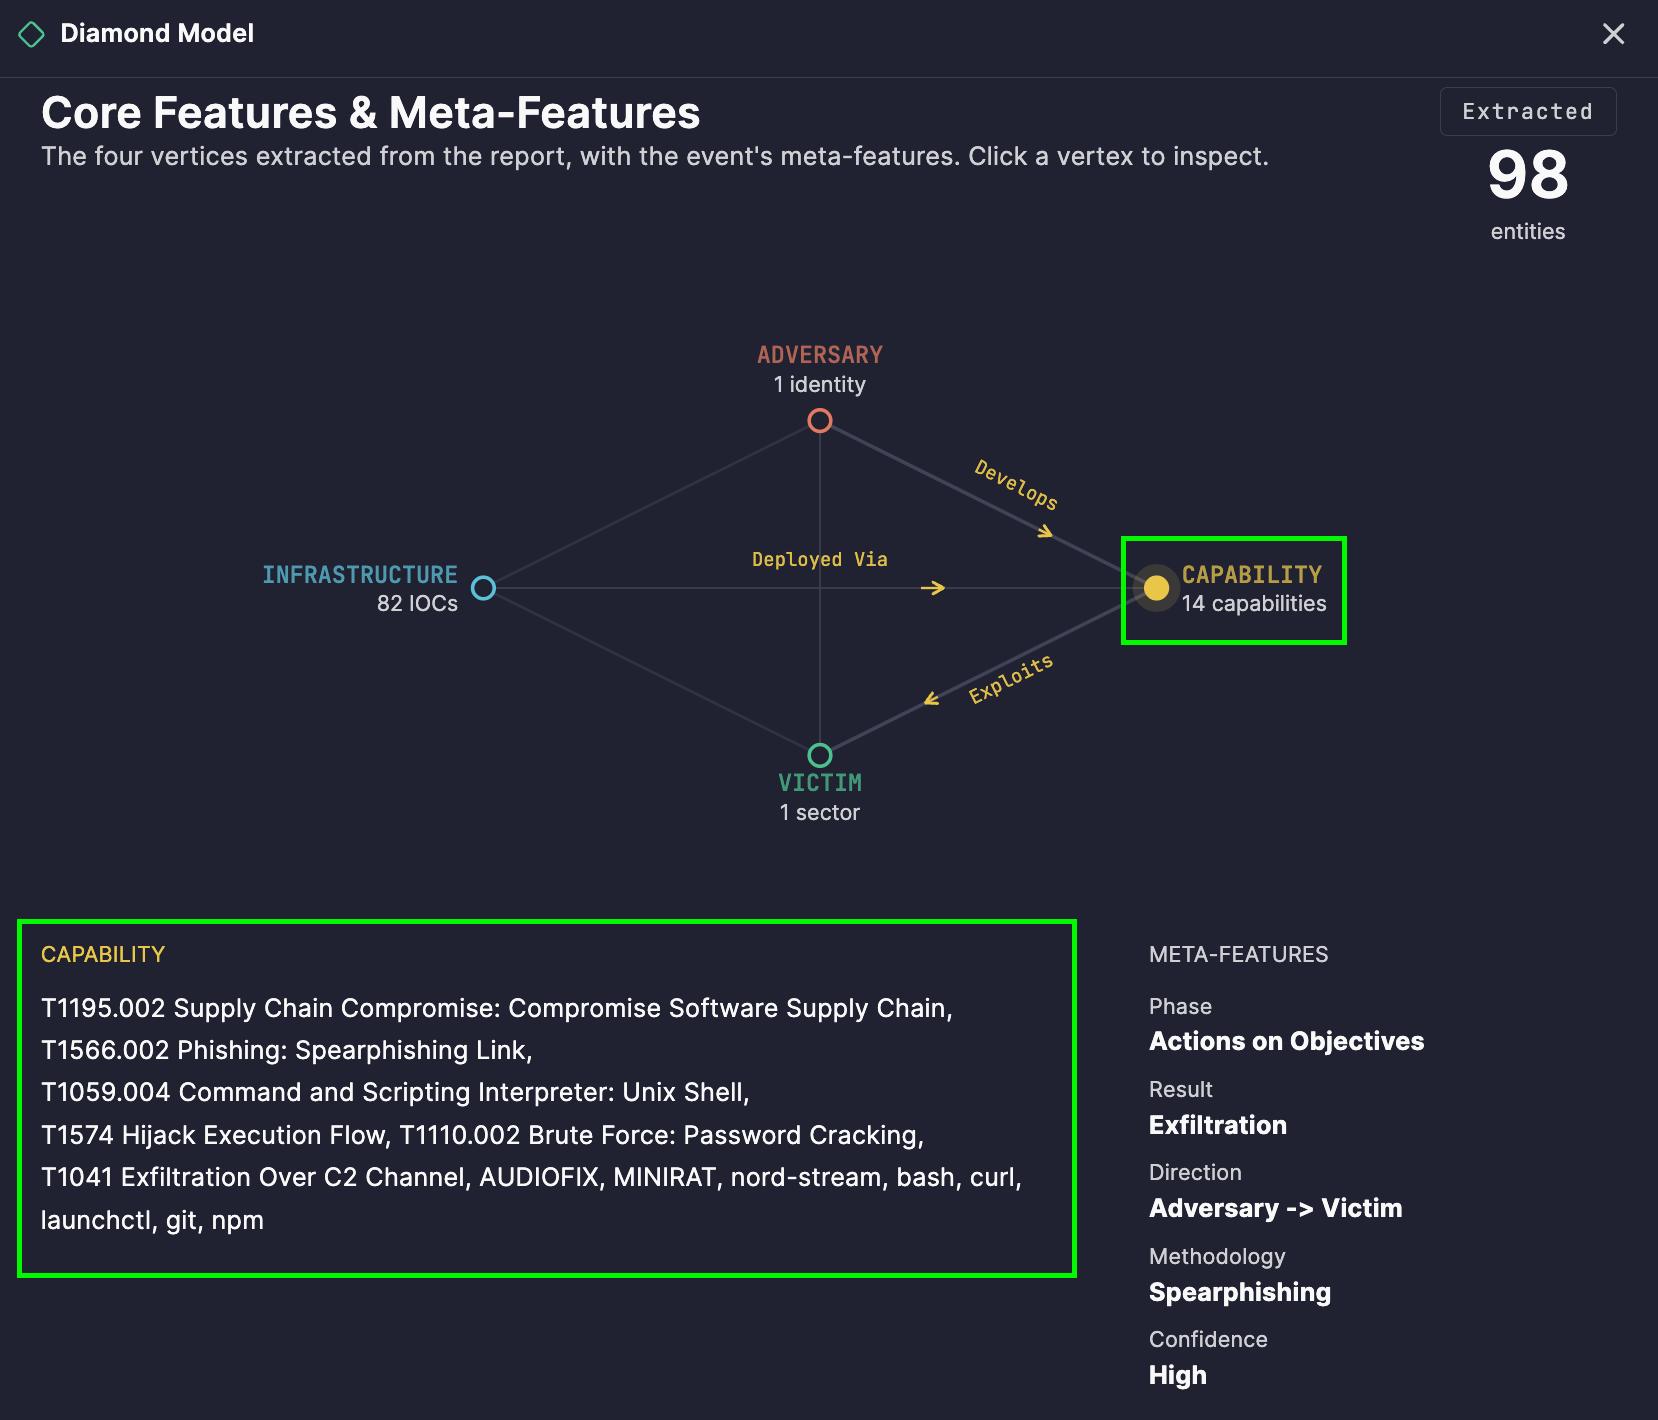
To dig into specifics, click any vertex to view the corresponding entity list below the diagram — so you can move seamlessly from the high-level relationship map to the underlying details.
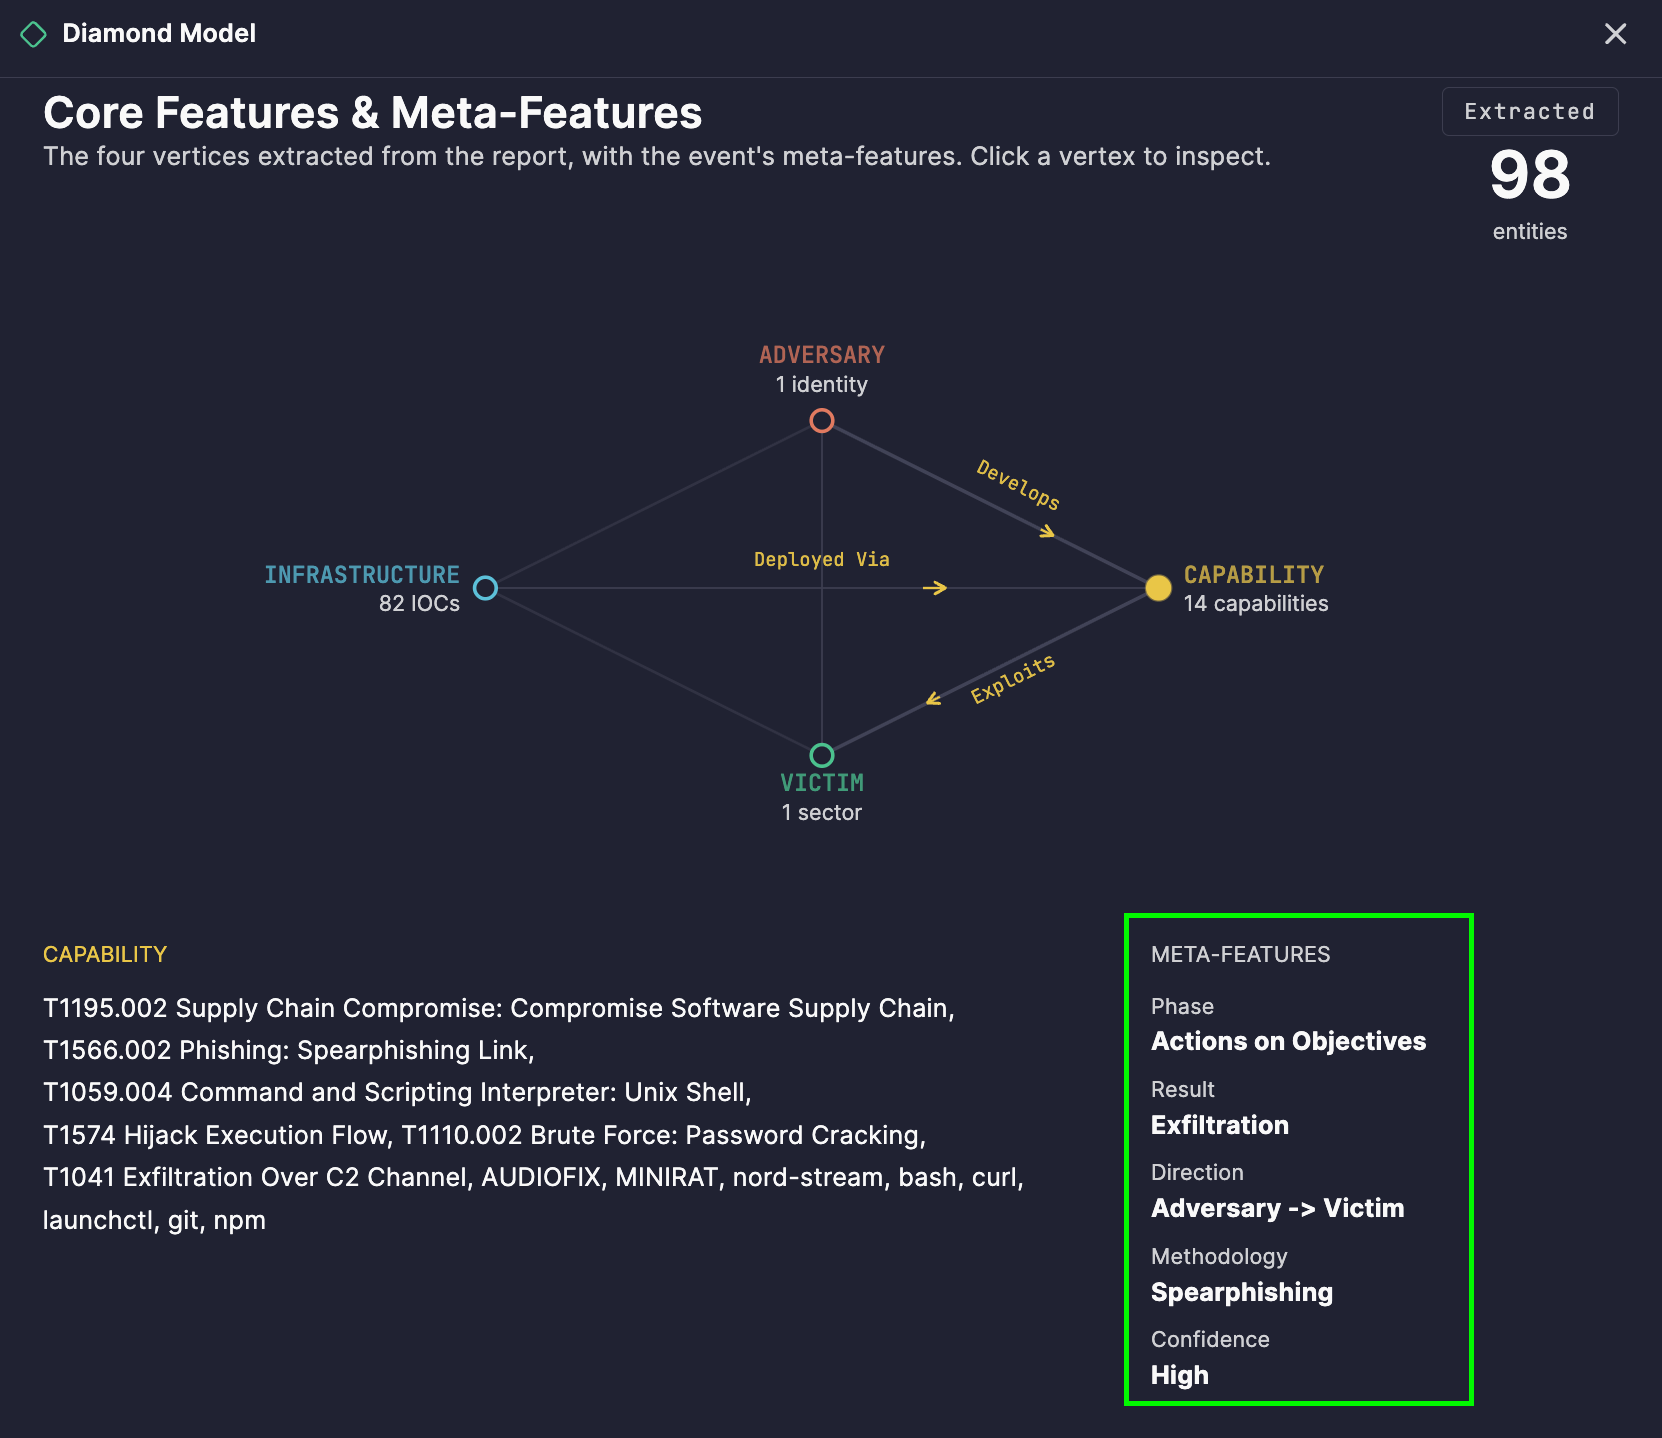
The diagram also includes meta-features — Phase, Result, Direction, Methodology, and Confidence — which add crucial context around the analyzed activity, such as where in the intrusion lifecycle the activity occurred, whether it succeeded, and how confident the analysis is in the mapped relationships.
From Visualization to Action
1. Attribution and actor tracking
By consistently mapping adversaries to their capabilities and infrastructure across multiple analyzed reports, teams can spot overlapping patterns that support attribution to a known threat actor or campaign.
2. Infrastructure and tooling analysis
Seeing which infrastructure supports which capabilities helps defenders anticipate an adversary’s next move — if you’ve identified the infrastructure behind one campaign, related activity becomes easier to detect.
3. Victim profiling and risk assessment
Understanding who adversaries typically target, and through what capabilities, helps security teams assess whether their own organization fits a known targeting pattern.
4. Structured incident storytelling
The four-vertex structure makes it easy to explain an intrusion to stakeholders in clear terms: who did it, how, through what, and against whom — without digging through technical specifics.
5. Confidence-driven prioritization
The Confidence meta-feature helps analysts weigh how much trust to place in a given relationship, so response and remediation efforts can be prioritized around well-supported findings rather than speculative ones.
How to Generate It
- Open Prime Architect and go to the Agentic Threat Research mode.
- Click Code Editor in the upper-right corner and paste the text of your threat report.
- Select Analyze.
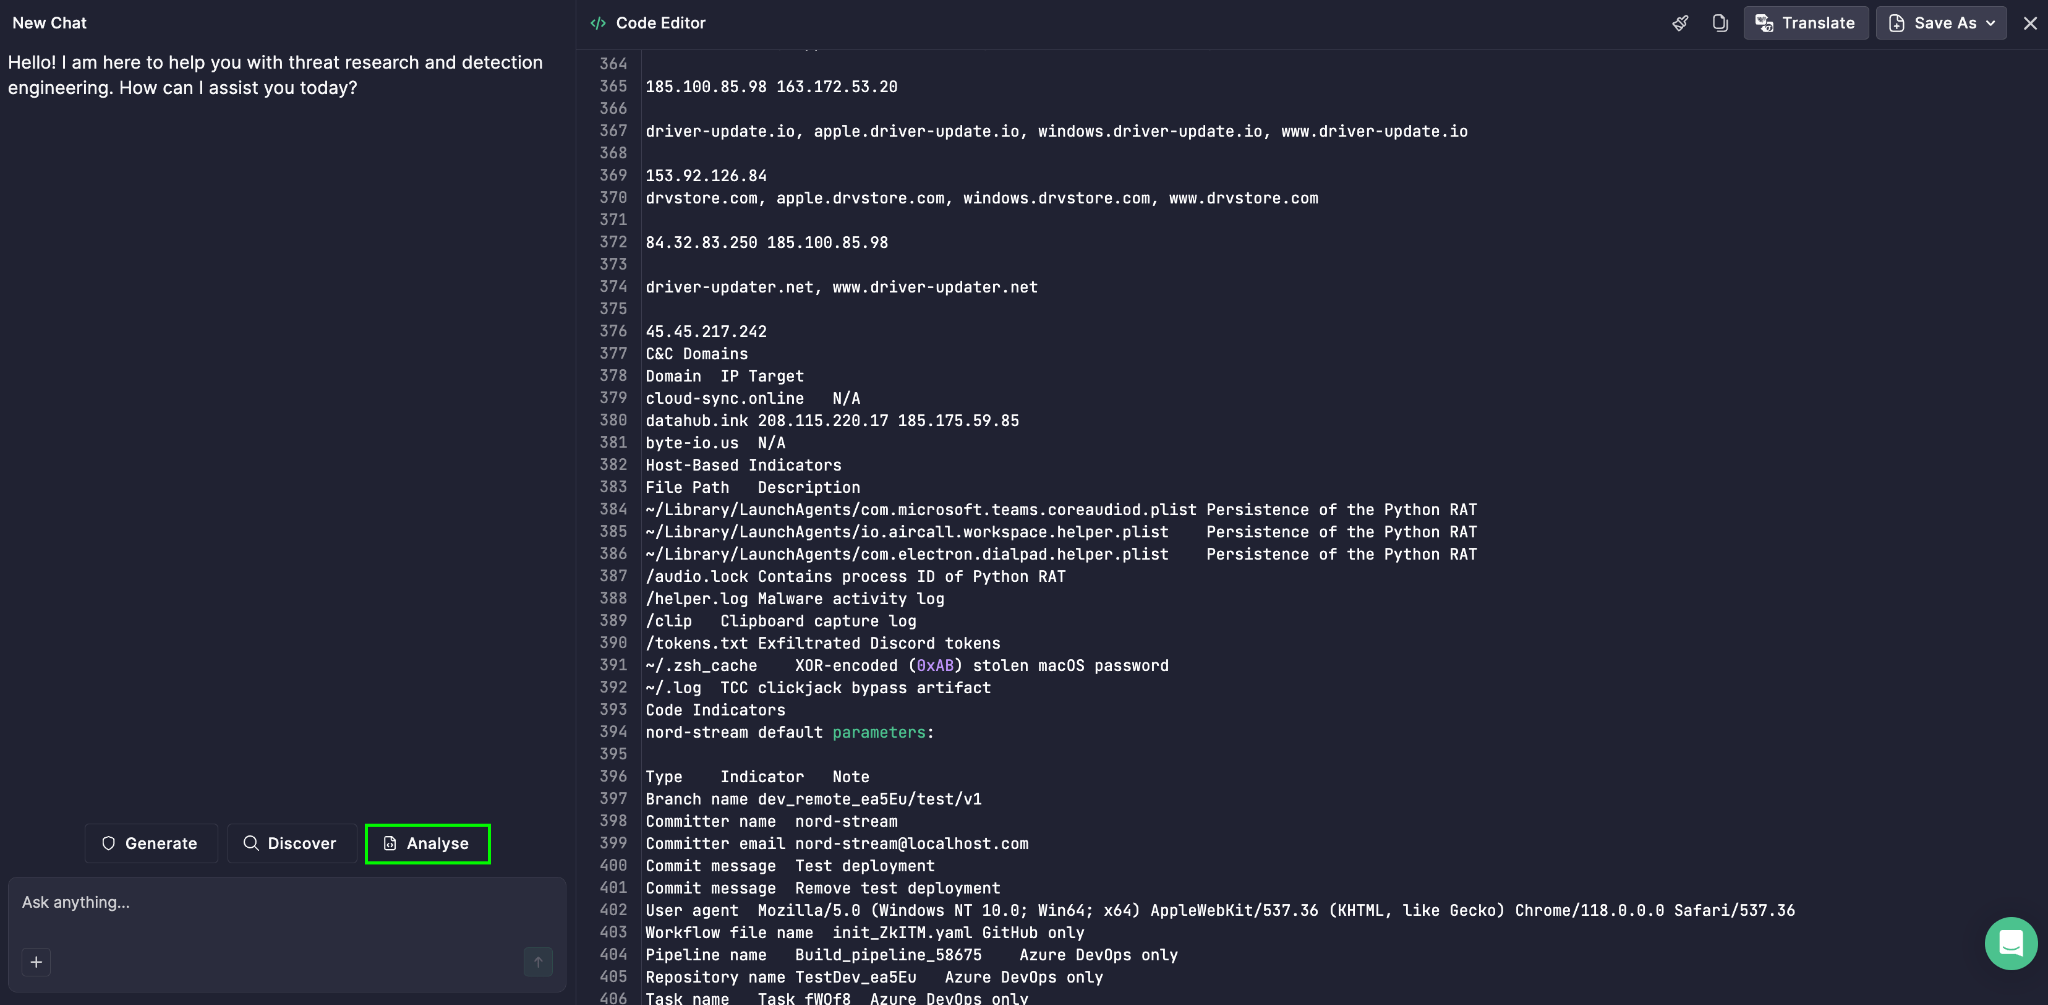
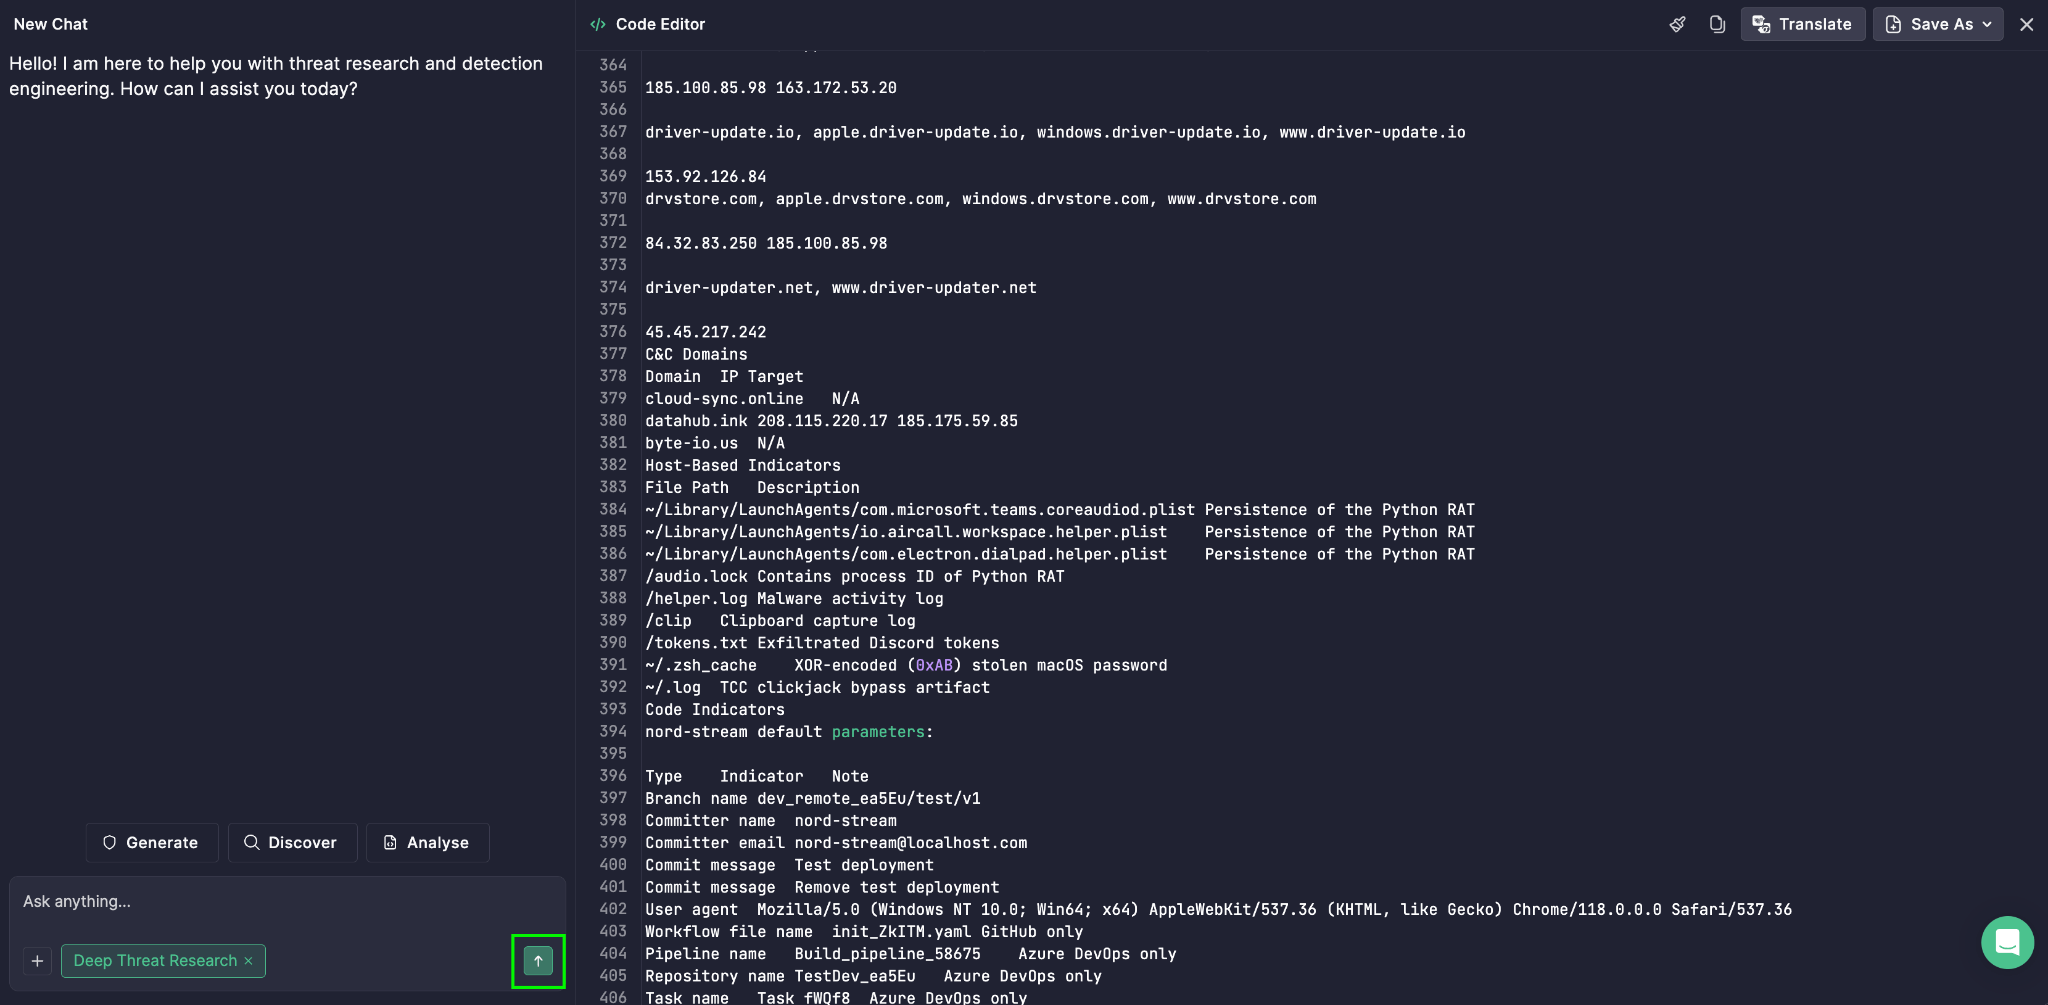
- Choose Deep Threat Research from the list.
- Click the Enter icon to run the analysis.
The Diamond Model then appears alongside other outputs, giving your team a structural, relationship-driven view of the threat — one that connects the adversary, their capability, their infrastructure, and their victim into a single, coherent picture.