Follow
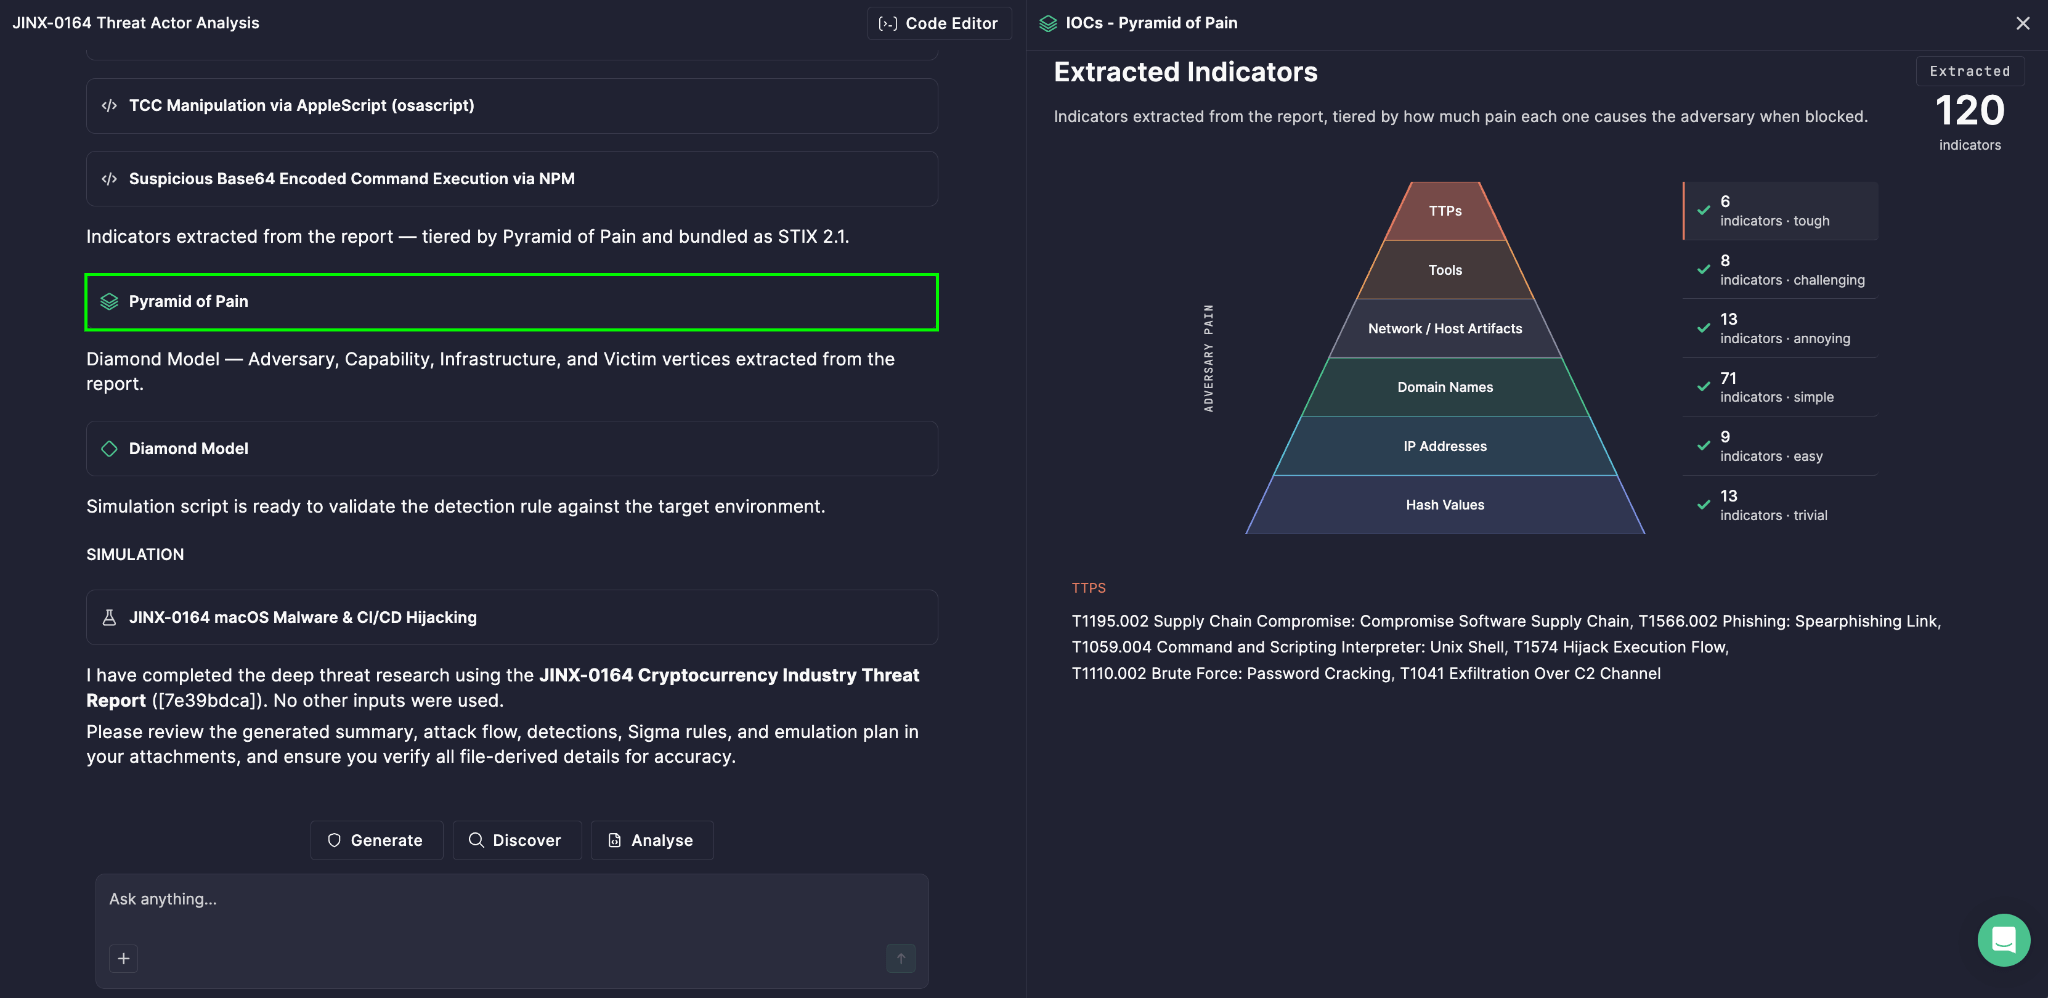
 Not all indicators of compromise are created equal. A malicious IP address can be swapped out in minutes; an adversary’s core tactics, techniques, and procedures take months — sometimes years — to rebuild. That’s why Prime Architect visualizes threat indicators using the Pyramid of Pain — generated automatically as part of Deep Threat Research analysis, helping your team focus detection efforts where they actually hurt the adversary.
The Model Behind the Visualization
The Pyramid of Pain threat intelligence framework ranks indicators of compromise not by how easy they are to find, but by how much disruption they cause an adversary when detected and blocked. The underlying logic is simple: some indicators are trivial for attackers to change, while others sit at the core of their operational identity — changing them requires real cost, time, and retooling.
The Pyramid of Pain categorizes threat indicators into six levels, arranged from the base of the pyramid (low pain) to the top (high pain):
- Hash Values — trivially easy to change; a single byte modification produces a new hash
- IP Addresses — easy to rotate, especially with cloud infrastructure or proxies
- Domain Names — somewhat harder to change, but still replaceable with moderate effort
- Network/Host Artifacts — patterns left behind by tools or activity, requiring more rework to avoid
- Tools — the utilities and malware an adversary relies on; replacing them takes real development effort
- Tactics, Techniques, and Procedures (TTPs) — the adversary’s actual behavior and tradecraft; the hardest and most costly element to change, since it’s tied to how they operate at a fundamental level
In Prime Architect, the Pyramid of Pain visualizes these six tiers based on the indicators actually extracted from the analyzed threat report, giving your team an immediate, ranked view of what was found — and, more importantly, how much of it truly matters.
What’s Really Happening at Each Tier
Each tier in the pyramid isn’t just a category — it’s a signal about strategic value. A report full of hash values and IP addresses may look rich in indicators, but if it’s light on TTPs, the actionable intelligence is thinner than it appears. Conversely, indicators found near the top of the pyramid represent durable insight into how the adversary operates, which stays relevant even after they change infrastructure.
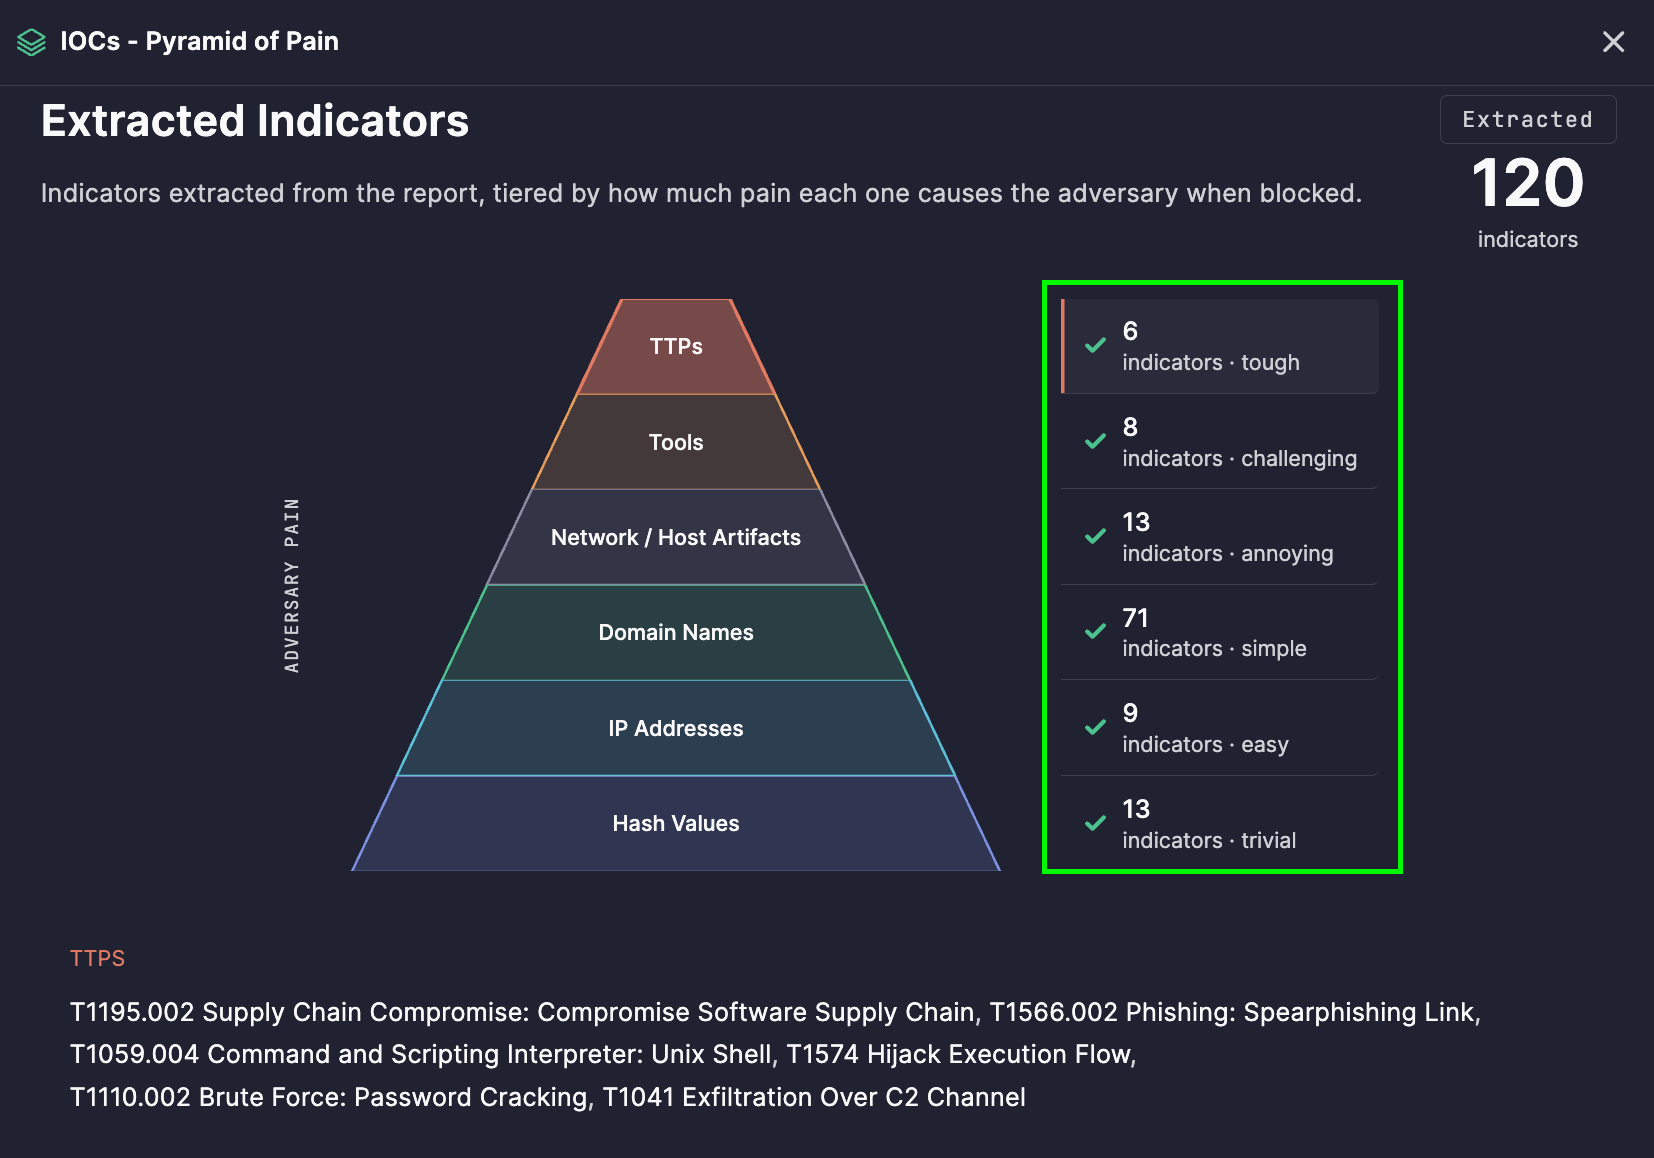
The panel on the right of the visualization displays the number of indicators extracted for each tier alongside its corresponding pain level, so you can see at a glance whether your intelligence skews toward easily-replaced artifacts or toward high-value behavioral detail.
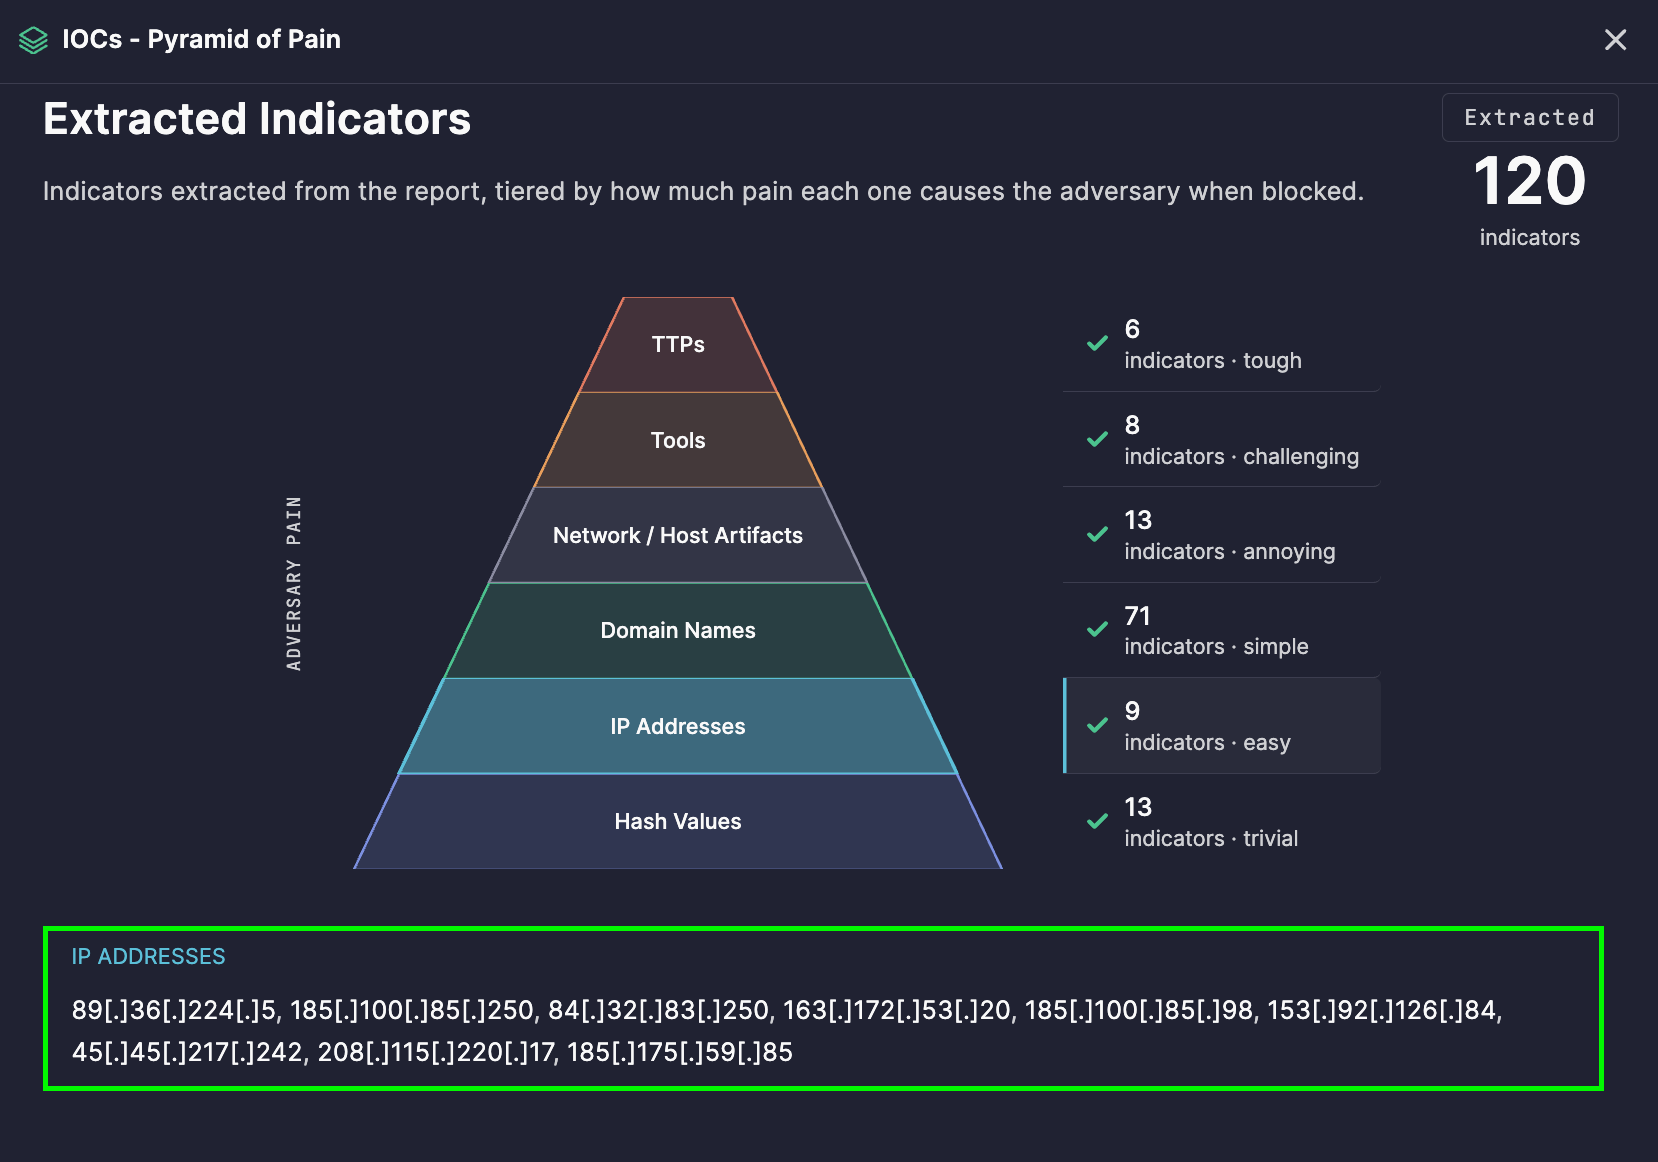
To review indicators by category, simply click the corresponding pyramid tier — the list of indicators associated with that tier appears directly below the pyramid.
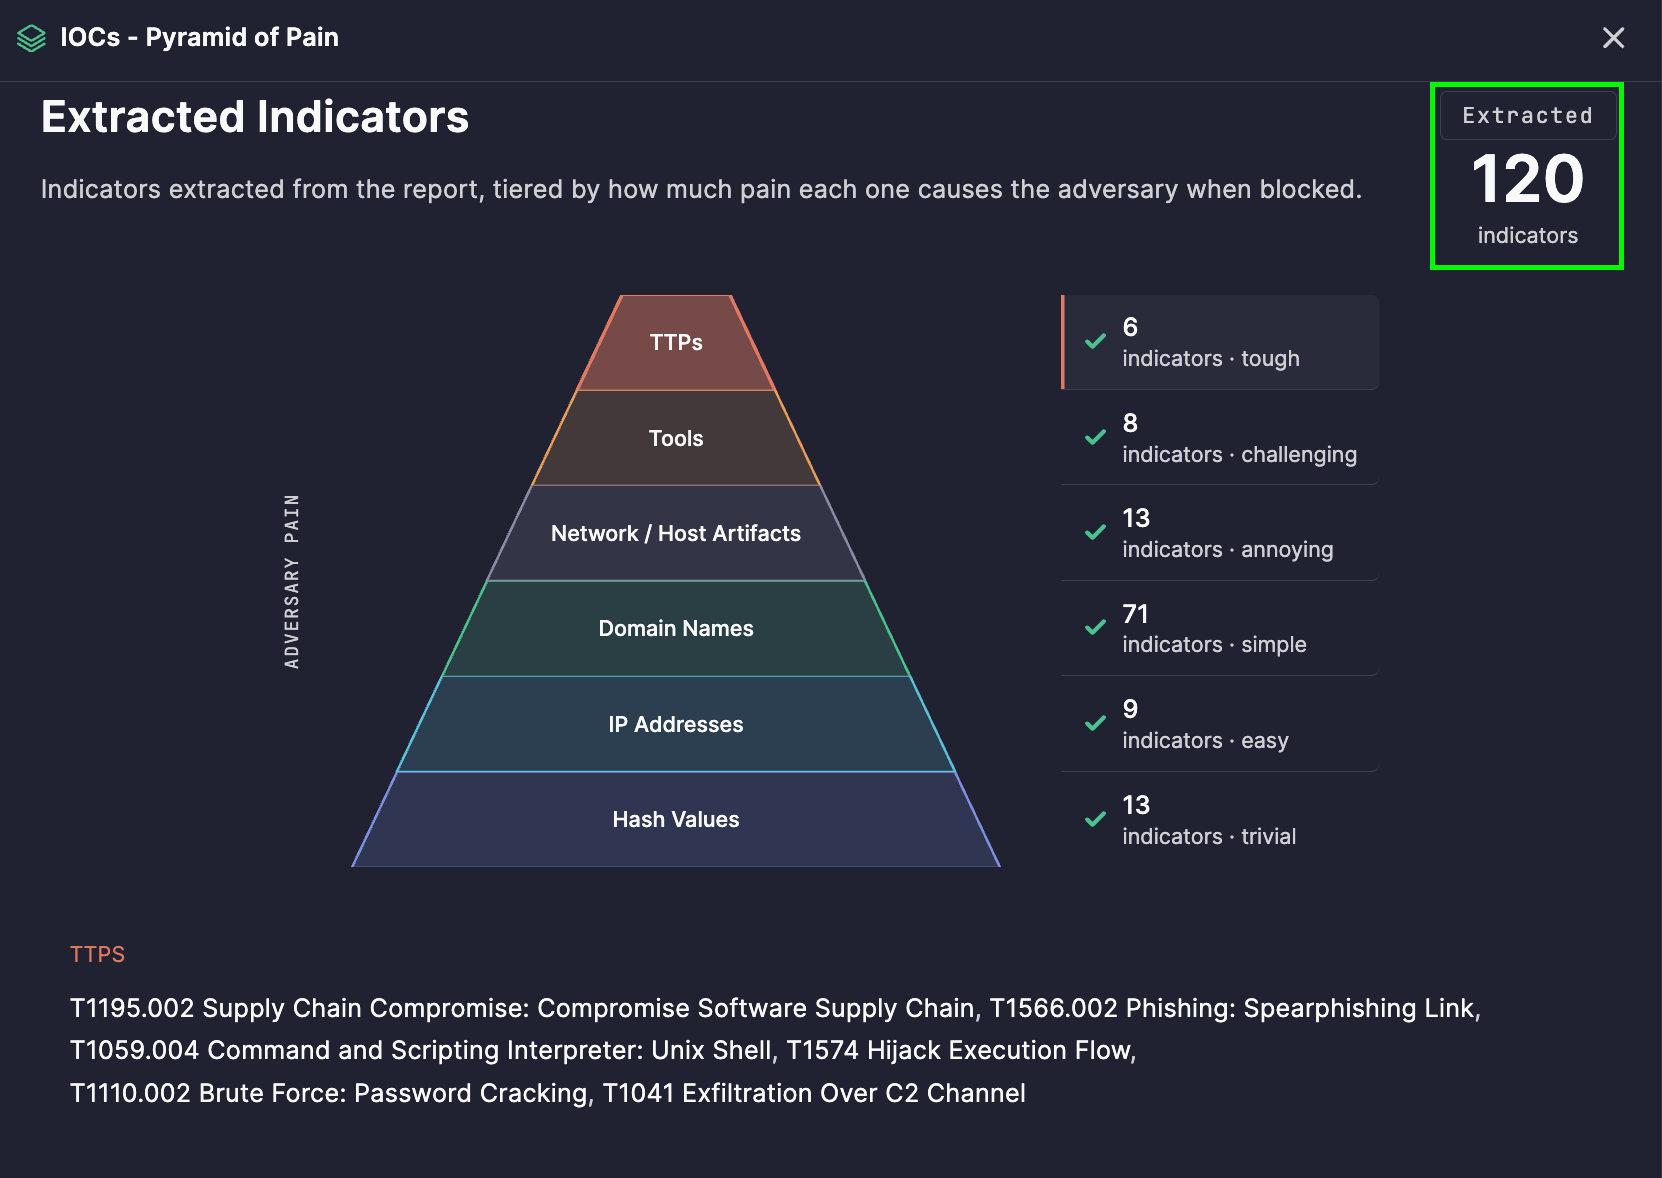
In the upper-right corner, a total extracted indicators count shows the overall number of indicators identified during the analysis — giving you a quick sense of scale before diving into specifics.
From Visualization to Action
1. Prioritizing detection engineering
Teams can use the pyramid to decide where to invest detection effort. Detections built around TTPs and tools remain effective far longer than those built solely around hashes or IPs, which adversaries can bypass with minimal effort.
2. Assessing intelligence quality
A quick glance at tier distribution tells you whether a threat report offers durable strategic value or just short-lived tactical indicators — useful for triaging which reports deserve deeper investigation.
3. Threat hunting
Higher-tier indicators — Network/Host Artifacts, Tools, and TTPs — make excellent starting points for proactive threat hunts, since they’re far less likely to have changed since the report was published.
4. Communicating impact to leadership
The pyramid’s intuitive “pain” concept makes it easy to explain, in non-technical terms, why certain detections are more valuable and durable than others.
5. Long-term adversary tracking
Because TTPs are the hardest element for adversaries to change, tracking them across multiple analyzed reports helps identify recurring behavior tied to the same threat actor or campaign, even as their infrastructure shifts.
How to Generate It
- Open Prime Architect and go to the Agentic Threat Research mode.
- Click Code Editor in the upper-right corner and paste the text of your threat report.
- Select Analyze.
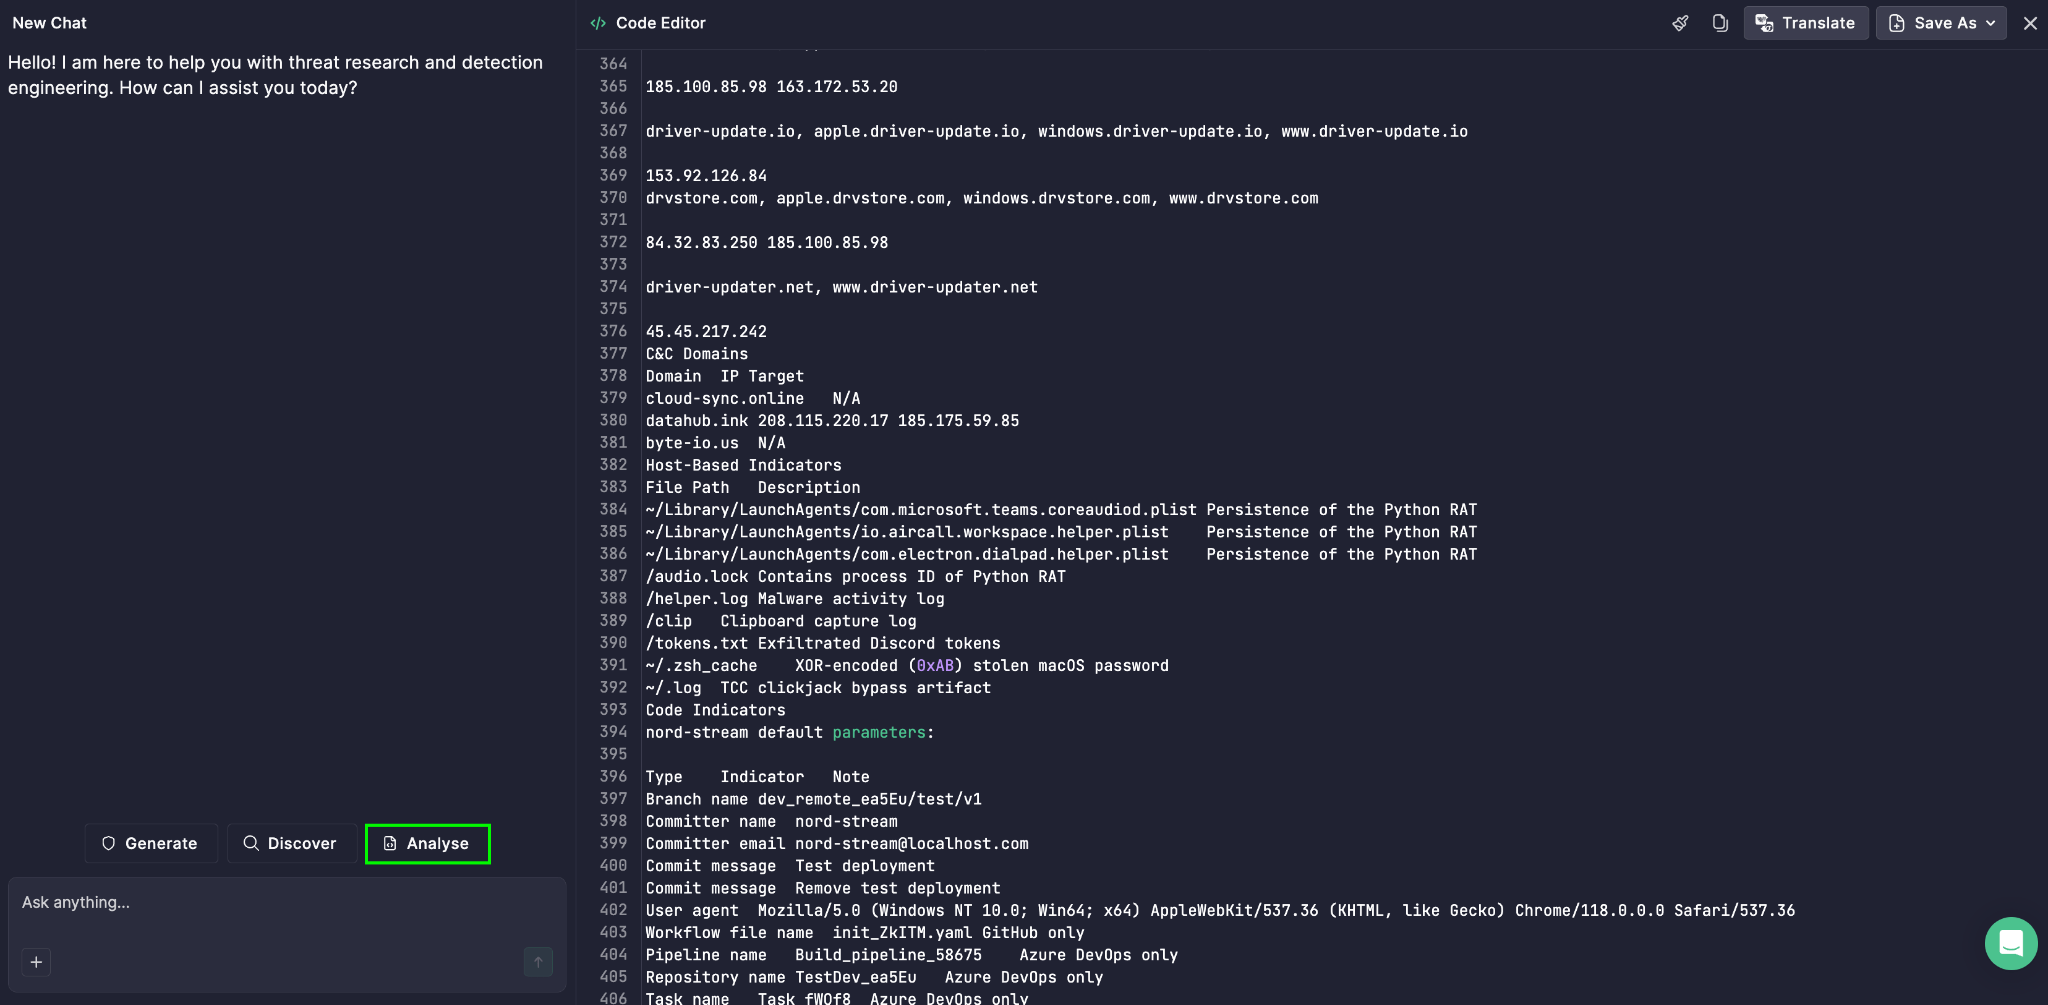
- Choose Deep Threat Research from the list.
- Click the Enter icon to run the analysis.
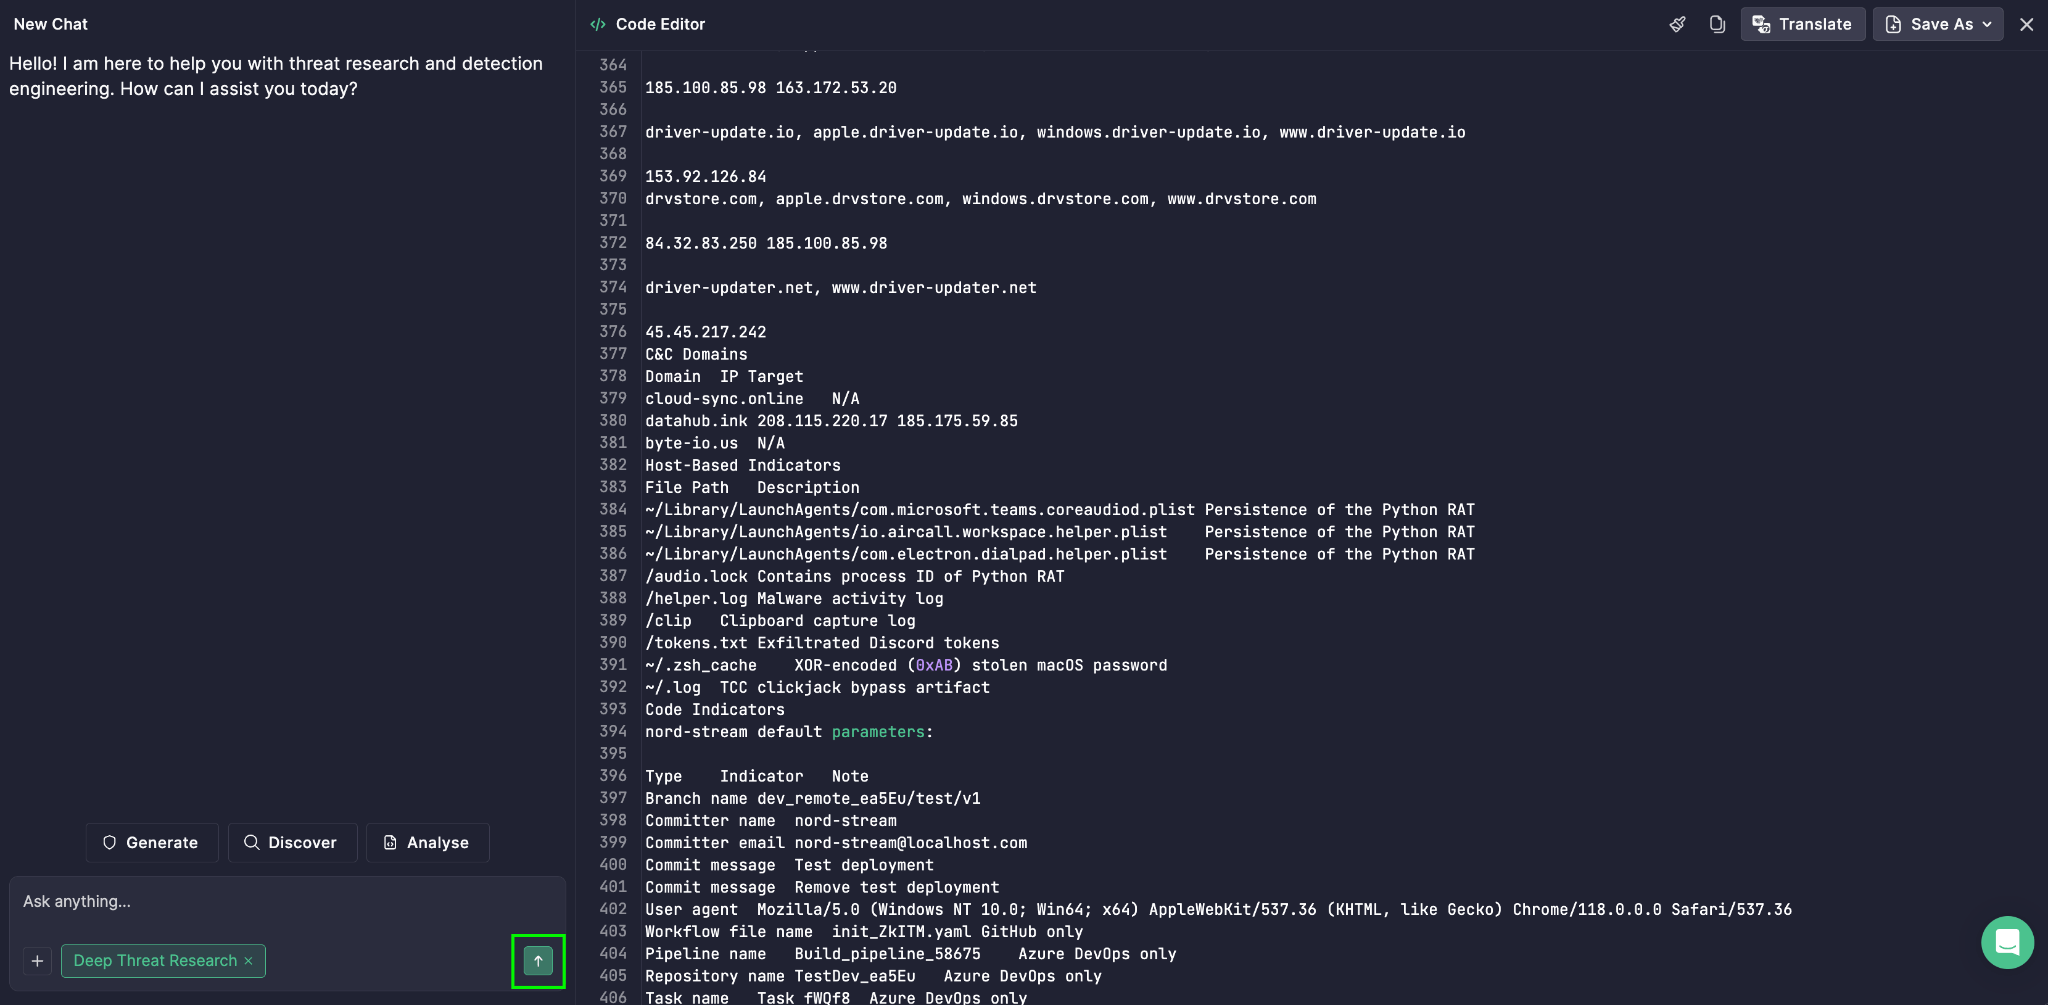
The Pyramid of Pain then appears alongside other outputs, giving your team a complete, multi-angle view of the threat and its most durable indicators.